Comparative Study
. 2007 Oct 17;27(42):11401-11.
doi: 10.1523/JNEUROSCI.3002-07.2007.

Activations in visual and attention-related areas predict and correlate with the degree of perceptual learning

Affiliations
Comparative Study

Activations in visual and attention-related areas predict and correlate with the degree of perceptual learning

Ikuko Mukai et al. J Neurosci. .

Abstract

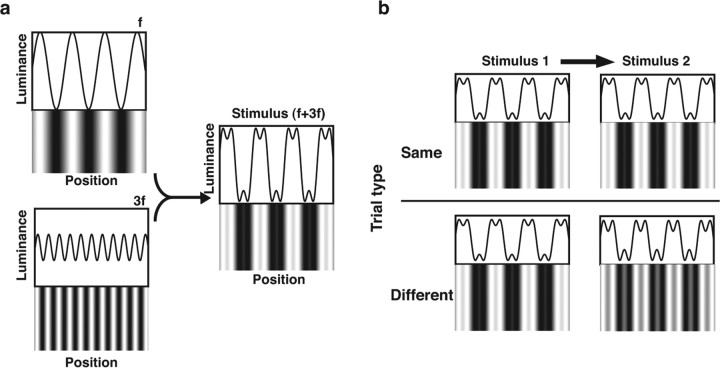
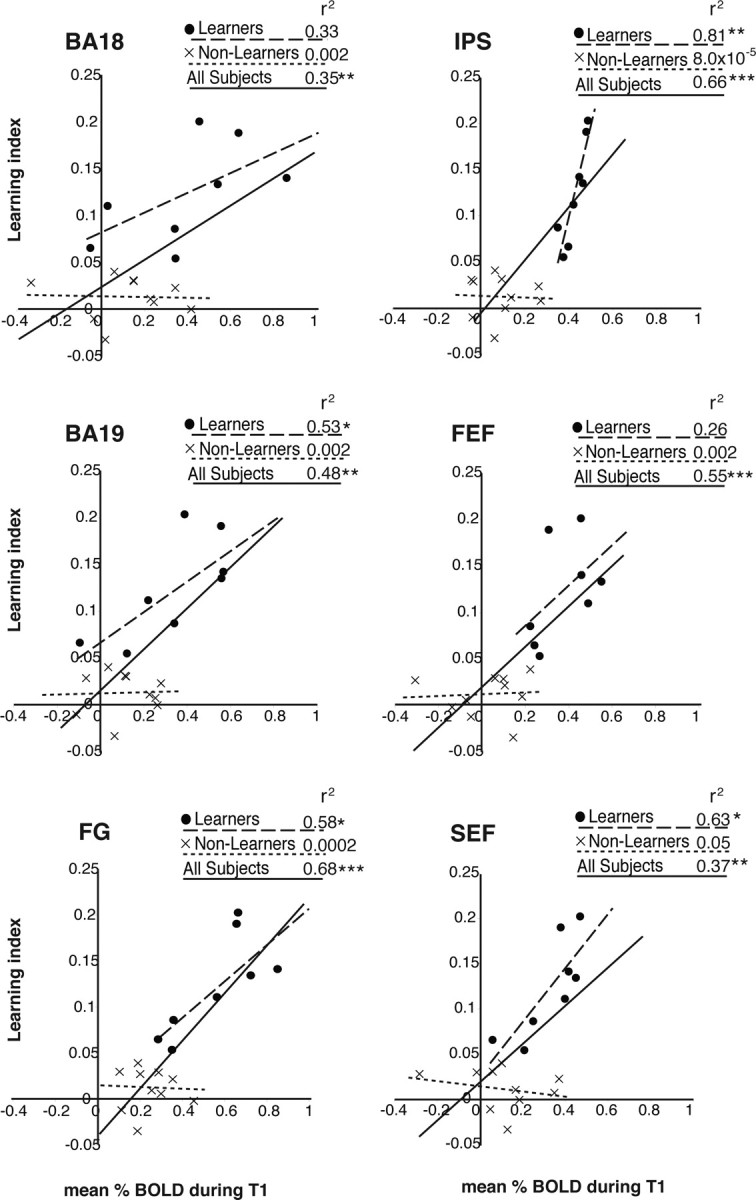
Repeated experience with a visual stimulus can result in improved perception of the stimulus, i.e., perceptual learning. To understand the underlying neural mechanisms of this process, we used functional magnetic resonance imaging to track brain activations during the course of training on a contrast discrimination task. Based on their ability to improve on the task within a single scan session, subjects were separated into two groups: "learners" and "nonlearners." As learning progressed, learners showed progressively reduced activation in both visual cortex, including Brodmann's areas 18 and 19 and the fusiform gyrus, and several cortical regions associated with the attentional network, namely, the intraparietal sulcus (IPS), frontal eye field (FEF), and supplementary eye field. Among learners, the decrease in brain activations in these regions was highly correlated with the magnitude of performance improvement. Unlike learners, nonlearners showed no changes in brain activations during training. Learners showed stronger activation than nonlearners during the initial period of training in all these brain regions, indicating that one could predict from the initial activation level who would learn and who would not. In addition, over the course of training, the functional connectivity between IPS and FEF in the right hemisphere with early visual areas was stronger for learners than nonlearners. We speculate that sharpened tuning of neuronal representations may cause reduced activation in visual cortex during perceptual learning and that attention may facilitate this process through an interaction of attention-related and visual cortical regions.


Figures

Figure 1.
Figure 1.
Examples of luminance profile and stimulus pattern used in the current study. a, A stimulus consisted of two sinusoidal gratings: sine wave of spatial frequency f and 3f. b, Two trial types for a task trial, same and different. During same trials, the two subsequently presented stimuli were identical. During different trials, the contrast of the third harmonic component of the stimulus was different between stimulus 1 and stimulus 2; on half of the trials, the contrast of the third harmonic component of the stimulus was higher in stimulus 1 than that in stimulus 2, and in half of the trials it was lower.
Figure 2.
Figure 2.
Time course of a trial. a, Task trial. Stimulus 1 and stimulus 2 were presented successively for 50 ms with an interstimulus interval of 600 ms. A response period followed the stimulus presentations and lasted for 1 s. During the response period, if the subject's response was correct, then the word “YES” was presented in green during a feedback period after the response period. If the subject's response was incorrect, then the word “NO” was presented in red. If the subject did not respond during the response period, the words “NO RESPONSE” were presented in blue. b, Fixation trial. A black fixation spot was presented in the middle of the visual field, and the color of the spot changed to white after 800 ms. Subjects were instructed to press a button as soon as they detected the change. No feedback was provided for the task. The color of the fixation spot changed back to black at 1100 ms from the beginning of a trial. The next task started right after one task concluded. ISI, Interstimulus interval. Diagonal arrows represent the flow of time during a task.
Figure 3.
Figure 3.
Averaged slope of the learning curves (black line) for learners and nonlearners. A slope of the learning curve for each individual subject was obtained by fitting a linear function to percentage correct data over trials. Shaded areas depict SEM. The learners' mean slope was significantly larger than the nonlearners'. *, Independent samples t test, t(16) = 5.9, p = 2.0 × 10⁻⁵.
Figure 4.
Figure 4.
Brain areas showing activations correlated with learning. The results of trend analysis on learners' group data. a, Averaged BOLD signal in ROIs are shown as a function of performance improvement: visual areas in blue and attention-related areas in green. b–e, The clustered areas that survived familywise correction for multiple comparisons. The results are superimposed onto a single subject's inflated brain surface that was aligned to the group fMRI data in Talairach space. The colors were coded to represent p values in each voxel. b, Ventral view showing BA18, BA19, and FG. c, Dorsal view showing IPS, FEF, SEF, and dorsolateral PFC (DLPFC). d, Posterior view showing BA18, BA19, and IPS. e, Medial view showing BA18 and SEF. L, Left; R, right.
Figure 5.
Figure 5.
Activations in early visual areas that responded to task versus fixation (left) and were correlated with learning (right) for two individual subjects. The results were superimposed onto each subject's flattened surface of the occipital lobe along with their retinotopic maps. The white lines represents boundaries between visual areas. The colors were coded to represent p values in each voxel. The results show higher activation during task than fixation trials and decreased activation as behavior improved. Activation changes were seen as early as V1 but mainly in V3–V4 and beyond. L, Left; R, right.
Figure 6.
Figure 6.
Correlation between the magnitudes of learning and decreases in brain activation in six ROIs. Learning index (slope of the learning curve) was used as a measure of learning. The results for the ROIs in visual cortex (a) and for the ROIs in attention-related areas (b). Each data point for an ROI represents one individual subject. The correlations were all significant, simple linear regression; *p < 0.05, **p < 0.01, ***p < 0.001.
Figure 7.
Figure 7.
Comparisons of learners' and nonlearners' group data. a, d, Averaged brain activations in the ROIs were plotted over the time course of training. The results are shown for the ROIs in visual cortex, BA18, BA19, and FG, and attention-related areas, IPS, FEF, and SEF. The error bars represent SEM. b, c, The results of voxelwise comparisons are superimposed on a surface model of the N27 (Holmes et al., 1998) in Talairach space. The top row shows the ventral view, and the bottom row shows the dorsal view of the brain. B, Contrasts of BOLD response between T1 and T4. The results of learners are shown on the left and nonlearners on the right. c, Contrasts of BOLD response during T1 between learners and nonlearners. The colors were coded to represent p values in each voxel: blue, negative t value; red, positive t value. L, Left; R, right.
Figure 8.
Figure 8.
Correlation between brain activation during T1 and magnitude of learning. Learning index (slope of the learning curve) was used as a measure of learning. Each data point for an ROI represents one individual subject. Simple linear regression; *p < 0.05, **p < 0.01, ***p < 0.001.
Figure 9.
Figure 9.
Comparisons of learners' and nonlearners' functional connectivity among visual and attention-related areas. a, A schematic diagram showing the results of t test (ROIs) between learners and nonlearners. Red and blue lines represented functionally stronger connections between areas for the learners and nonlearners, respectively. Visual areas are in rectangles, and attention-related areas are in ovals. b–d, Results of t test (voxelwise) between learners' and nonlearners' z scores of connectivity. The results are superimposed onto a single subject's brain volume. The colors were coded to represent p values in each voxel; red represents correlations for learners > nonlearners, and blue represents correlations for nonlearners > learners. b, An axial view (z = −5) showing stronger connections between the left BA19 (seed ROI) and bilateral FG for nonlearners. c, An axial view (z = 44) showing stronger connections between the left BA19 (seed ROI) and IPS/FEF in the right hemisphere for learners. d, A coronal view (y = −86) showing stronger connections between the right IPS (seed ROI) and bilateral BA18/BA19 for learners. L, Left; R, right.

References

    1. Ahissar M, Hochstein S. Learning pop-out detection: specificities to stimulus characteristics. Vision Res. 1996;36:3487–3500. - PubMed
    1. Ahissar M, Hochstein S. Task difficulty and the specificity of perceptual learning. Nature. 1997;387:401–406. - PubMed
    1. Ahissar M, Hochstein S. The role of attention in learning simple visual tasks. In: Fahle M, Poggio T, editors. Perceptual learning. Cambridge, MA: MIT; 2002. pp. 253–272.
    1. Argall BD, Saad ZS, Beauchamp MS. Simplified intersubject averaging on the cortical surface using SUMA. Hum Brain Mapp. 2006;27:14–27. - PMC - PubMed
    1. Ball K, Sekuler R. Direction-specific improvement in motion discrimination. Vision Res. 1987;27:953–965. - PubMed

Publication types