Review
. 2007 Nov;8(11):857-68.
doi: 10.1038/nrg2187.

Recent and ongoing selection in the human genome

Affiliations
Review

Recent and ongoing selection in the human genome

Rasmus Nielsen et al. Nat Rev Genet. 2007 Nov.

Abstract

The recent availability of genome-scale genotyping data has led to the identification of regions of the human genome that seem to have been targeted by selection. These findings have increased our understanding of the evolutionary forces that affect the human genome, have augmented our knowledge of gene function and promise to increase our understanding of the genetic basis of disease. However, inferences of selection are challenged by several confounding factors, especially the complex demographic history of human populations, and concordance between studies is variable. Although such studies will always be associated with some uncertainty, steps can be taken to minimize the effects of confounding factors and improve our interpretation of their findings.


Figures

Figure 1
Figure 1. Selective sweeps
The lines indicate individual DNA sequences or haplotypes, and derived SNP alleles are depicted as stars. A new advantageous mutation (indicated by a red star) appears initially on one haplotype. In the absence of recombination, all neutral SNP alleles on the chromosome in which the advantageous mutation first occurs will also reach a frequency of 100% as the advantageous mutation become fixed in the population. Likewise, SNP-alleles that do not occur on this chromosome will be lost, so that all variability has been eliminated in the region in which the selective sweep occurred. However, new haplotypes can emerge through recombination, allowing some of the neutral mutations that are linked to the advantageous mutation to segregate after a completed selective sweep. As the rate of recombination depends on the physical distance among sites, the effect of a selective sweep on variation in the genomic regions around it diminishes with distance from the site that is under selection. Chromosomal segments that are linked to advantageous mutations through recombination during the selective sweep are coloured yellow. Data that are sampled during the selective sweep at a time point when the new mutation has not yet reached a frequency of 100% represent an incomplete selective sweep.
Figure 2
Figure 2. The signature of an incomplete selective sweep in the region containing the lactase (LCT) gene
The LCT region shows a characteristic signature of an incomplete selective sweep. There is a haplotype of high frequency with strongly increased homozygosity as illustrated by the iHS (integrated haplotype score) statistic (data from REF. 40). There is a skew in the frequency spectrum as illustrated by the negative values of Tajima’s D (data from REF. 45), and a reduction in variability as shown by the estimate of the population genetic parameter θ (I. Hellmann, unpublished observations). Characteristically of many regions that show statistical evidence for an incomplete selective sweep, there is also a reduction in the local recombination rate (cM Mb−1; data from REF. 70). For the top two panels, the red lines represent the Asian and the blue lines represents the CEPH HapMap samples.
Figure 3
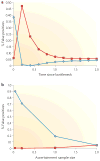
Figure 3. Effects of demography and ascertainment bias on tests of selection
a. The false positive rate of Tajima’s D in the presence of a population bottleneck. A sample of 50 chromosomes was simulated using coalescent simulations, and the time since a population bottleneck that reduced the population size tenfold was varied. The duration of the bottleneck was 0.1 × 2Ne generations, and time in the figure is measured in 2Ne generations, where Ne is the effective population size of a diploid population. Each simulated data set had 20 segregating sites. The proportion of time the test rejects at the 5% significance level in a one-sided test based on negative values (shown in red) and positive values (shown in blue) is shown. B. The false-positive rate of Tajima’s D in the presence of an ascertainment bias. Simulation conditions are as described in panel a, but the size of the ascertainment sample (expressed as a proportion of the final sample) used for SNP discovery is varied.

Similar articles

Cited by

References

    1. Akey JM, Zhang G, Zhang K, Jin L, Shriver MD. Interrogating a high-density SNP map for signatures of natural selection. Genome Res. 2002;12:1805–1814. - PMC - PubMed
    1. Andolfatto P. Adaptive evolution of non-coding DNA in Drosophila. Nature. 2005;437:1149–1152. - PubMed
    1. Bustamante CD, et al. Natural selection on protein-coding genes in the human genome. Nature. 2005;437:1153–1157. This paper reports a genome-wide scan for selection in humans based on a derivative of the MacDonald–Kreitman test. - PubMed
    1. Sabeti PC, et al. Positive natural selection in the human lineage. Science. 2006;312:1614–1620. This review contains a comprehensive list of genes that are thought to be under selection in humans. - PubMed
    1. Williamson SH, et al. Localizing recent adaptive evolution in the human genome. PLoS Genet. 2007;3:e90. - PMC - PubMed

Publication types