Differential distribution of proteins and lipids in detergent-resistant and detergent-soluble domains in rod outer segment plasma membranes and disks
- PMID: 17944869
- PMCID: PMC2823591
- DOI: 10.1111/j.1471-4159.2007.04971.x
Differential distribution of proteins and lipids in detergent-resistant and detergent-soluble domains in rod outer segment plasma membranes and disks
Abstract
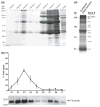
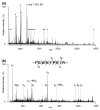
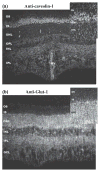
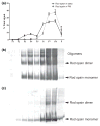
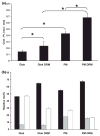
Membrane heterogeneity plays a significant role in regulating signal transduction and other cellular activities. We examined the protein and lipid components associated with the detergent-resistant membrane (DRM) fractions from retinal rod outer segment (ROS) disk and plasma membrane-enriched preparations. Proteomics and correlative western blot analysis revealed the presence of alpha and beta subunits of the rod cGMP-gated ion channel and glucose transporter type 1, among other proteins. The glucose transporter was present exclusively in ROS plasma membrane (not disks) and was highly enriched in DRMs, as was the cGMP-gated channel beta-subunit. In contrast, the majority of rod opsin and ATP-binding cassette transporter A4 was localized to detergent-soluble domains in disks. As expected, the cholesterol : fatty acid mole ratio was higher in DRMs than in the corresponding parent membranes (disk and plasma membranes, respectively) and was also higher in disks compared to plasma membranes. Furthermore, the ratio of saturated : polyunsaturated fatty acids was also higher in DRMs compared to their respective parent membranes (disk and plasma membranes). These results confirm that DRMs prepared from both disks and plasma membranes are enriched in cholesterol and in saturated fatty acids compared to their parent membranes. The dominant fatty acids in DRMs were 16 : 0 and 18 : 0; 22 : 6n3 and 18 : 1 levels were threefold higher and twofold lower, respectively, in disk-derived DRMs compared to plasma membrane-derived DRMs. We estimate, based on fatty acid recovery that DRMs account for only approximately 8% of disks and approximately 12% of ROS plasma membrane.
Figures




Similar articles
-
Detailed characterization of the lipid composition of detergent-resistant membranes from photoreceptor rod outer segment membranes.Invest Ophthalmol Vis Sci. 2005 Apr;46(4):1147-54. doi: 10.1167/iovs.04-1207. Invest Ophthalmol Vis Sci. 2005. PMID: 15790872
-
Recoverin and rhodopsin kinase activity in detergent-resistant membrane rafts from rod outer segments.J Biol Chem. 2004 Nov 19;279(47):48647-53. doi: 10.1074/jbc.M402516200. Epub 2004 Sep 7. J Biol Chem. 2004. PMID: 15355976
-
Localization of peripherin/rds in the disk membranes of cone and rod photoreceptors: relationship to disk membrane morphogenesis and retinal degeneration.J Cell Biol. 1992 Feb;116(3):659-67. doi: 10.1083/jcb.116.3.659. J Cell Biol. 1992. PMID: 1730772 Free PMC article.
-
The role of cholesterol in rod outer segment membranes.Prog Lipid Res. 2005 Mar-May;44(2-3):99-124. doi: 10.1016/j.plipres.2005.02.001. Epub 2005 Mar 9. Prog Lipid Res. 2005. PMID: 15924998 Free PMC article. Review.
-
Structure of detergent-resistant membrane domains: does phase separation occur in biological membranes?Biochem Biophys Res Commun. 1997 Nov 7;240(1):1-7. doi: 10.1006/bbrc.1997.7575. Biochem Biophys Res Commun. 1997. PMID: 9367871 Review.
Cited by
-
Tauroursodeoxycholic Acid (TUDCA)-Lipid Interactions and Antioxidant Properties of TUDCA Studied in Model of Photoreceptor Membranes.Membranes (Basel). 2021 Apr 29;11(5):327. doi: 10.3390/membranes11050327. Membranes (Basel). 2021. PMID: 33946822 Free PMC article.
-
Loss of caveolin-1 impairs retinal function due to disturbance of subretinal microenvironment.J Biol Chem. 2012 May 11;287(20):16424-34. doi: 10.1074/jbc.M112.353763. Epub 2012 Mar 26. J Biol Chem. 2012. PMID: 22451674 Free PMC article.
-
Role of membrane integrity on G protein-coupled receptors: Rhodopsin stability and function.Prog Lipid Res. 2011 Jul;50(3):267-77. doi: 10.1016/j.plipres.2011.03.002. Epub 2011 Mar 22. Prog Lipid Res. 2011. PMID: 21435354 Free PMC article. Review.
-
Protein and Signaling Networks in Vertebrate Photoreceptor Cells.Front Mol Neurosci. 2015 Nov 17;8:67. doi: 10.3389/fnmol.2015.00067. eCollection 2015. Front Mol Neurosci. 2015. PMID: 26635520 Free PMC article. Review.
-
Vision from next generation sequencing: multi-dimensional genome-wide analysis for producing gene regulatory networks underlying retinal development, aging and disease.Prog Retin Eye Res. 2015 May;46:1-30. doi: 10.1016/j.preteyeres.2015.01.005. Epub 2015 Feb 7. Prog Retin Eye Res. 2015. PMID: 25668385 Free PMC article. Review.
References
-
- Ahn J, Wong JT, Molday RS. The effect of lipid environment and retinoids on the ATPase activity of ABCR, the photoreceptor ABC transporter responsible for Stargardt macular dystrophy. J Biol Chem. 2000;275:20399–20405. - PubMed
-
- Albert AD, Boesze-Battaglia K, Paw Z, Watts A, Epand RM. Effect of cholesterol on rhodopsin stability in disk membranes. Biochim Biophys Acta. 1996a;1297:77–82. - PubMed
-
- Albert AD, Young JE, Yeagle PL. Rhodopsin-cholesterol interactions in bovine rod outer segment disk membranes. Biochim Biophys Acta. 1996b;1285:47–55. - PubMed
-
- Allen JA, Halverson-Tamboli RA, Rasenick MM. Lipid raft microdomains and neurotransmitter signalling. Nat Rev Neurosci. 2007;8:128–140. - PubMed
Publication types
MeSH terms
Substances
Grants and funding
- P20 RR017703/RR/NCRR NIH HHS/United States
- R01 EY010609/EY/NEI NIH HHS/United States
- EY10609/EY/NEI NIH HHS/United States
- R56 EY010609/EY/NEI NIH HHS/United States
- R03 EY016201/EY/NEI NIH HHS/United States
- EY012190/EY/NEI NIH HHS/United States
- EY007361/EY/NEI NIH HHS/United States
- P30 EY012190/EY/NEI NIH HHS/United States
- R01 EY013877/EY/NEI NIH HHS/United States
- R01 EY007361/EY/NEI NIH HHS/United States
- EY016201/EY/NEI NIH HHS/United States
- EY13877/EY/NEI NIH HHS/United States
- RR017703/RR/NCRR NIH HHS/United States
LinkOut - more resources
Full Text Sources
Research Materials

