. 2007 Dec;1768(12):3260-70.
doi: 10.1016/j.bbamem.2007.08.006. Epub 2007 Aug 24.

Local and global structure of the monomeric subunit of the potassium channel KcsA probed by NMR

Affiliations

Local and global structure of the monomeric subunit of the potassium channel KcsA probed by NMR

Jordan H Chill et al. Biochim Biophys Acta. 2007 Dec.

Abstract

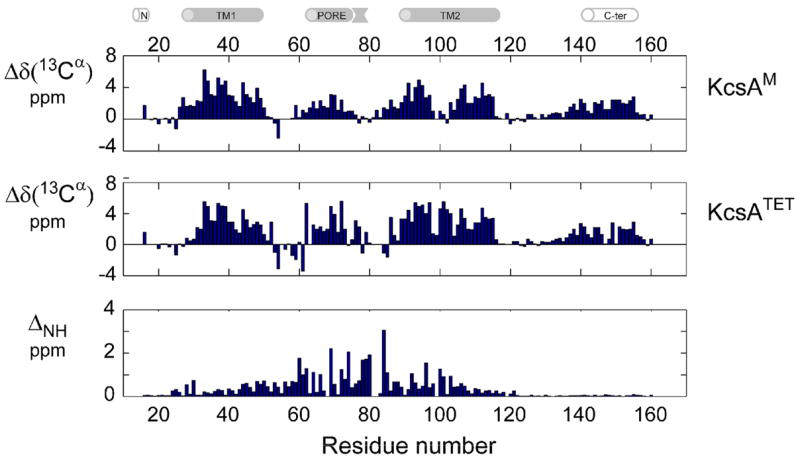
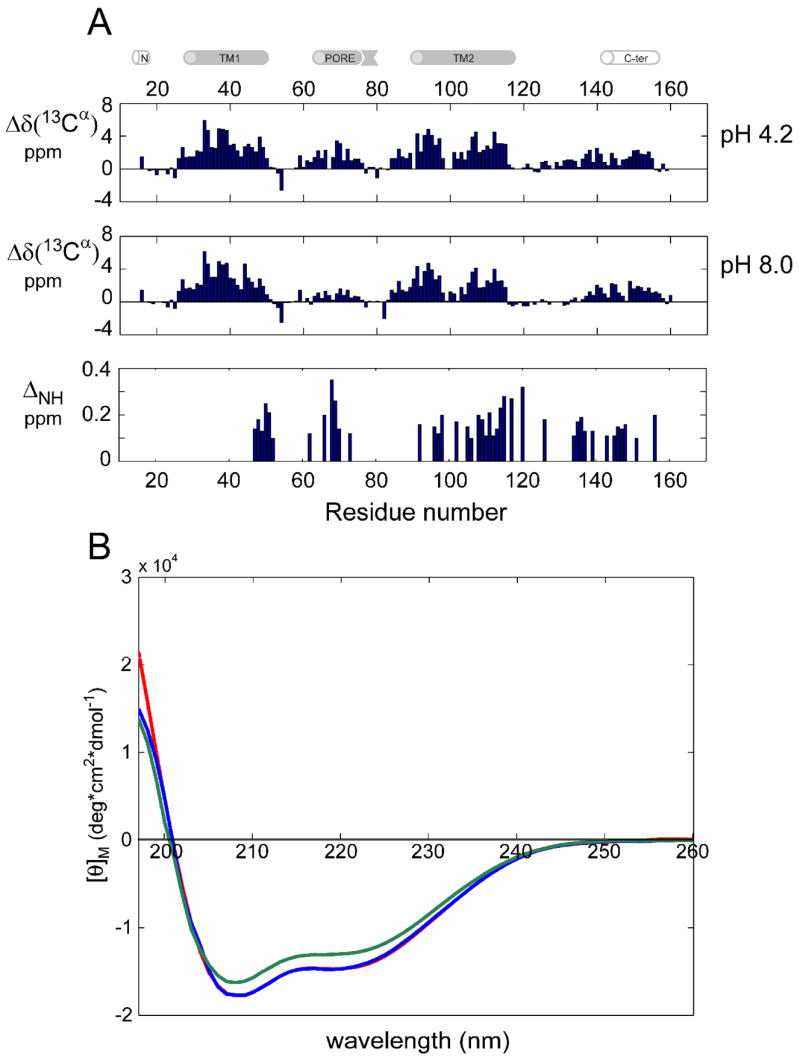
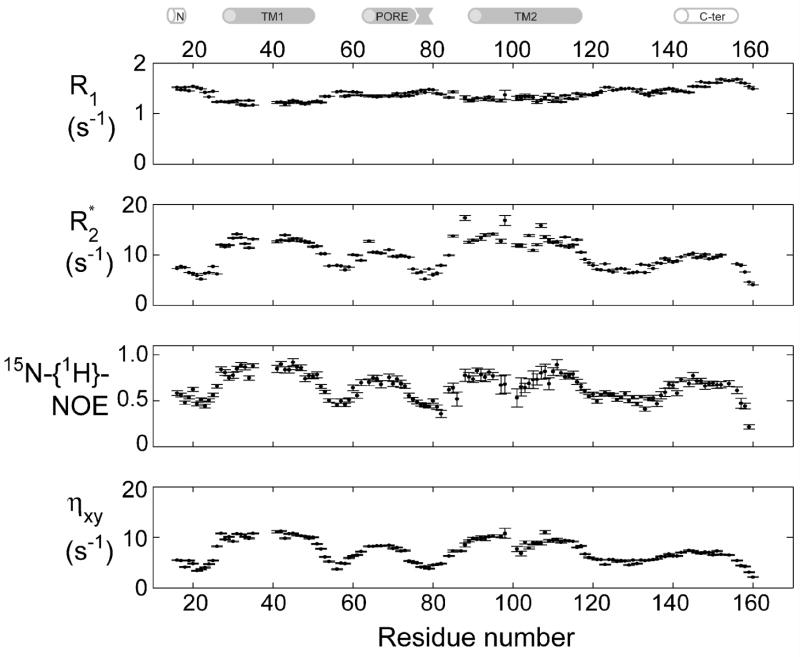
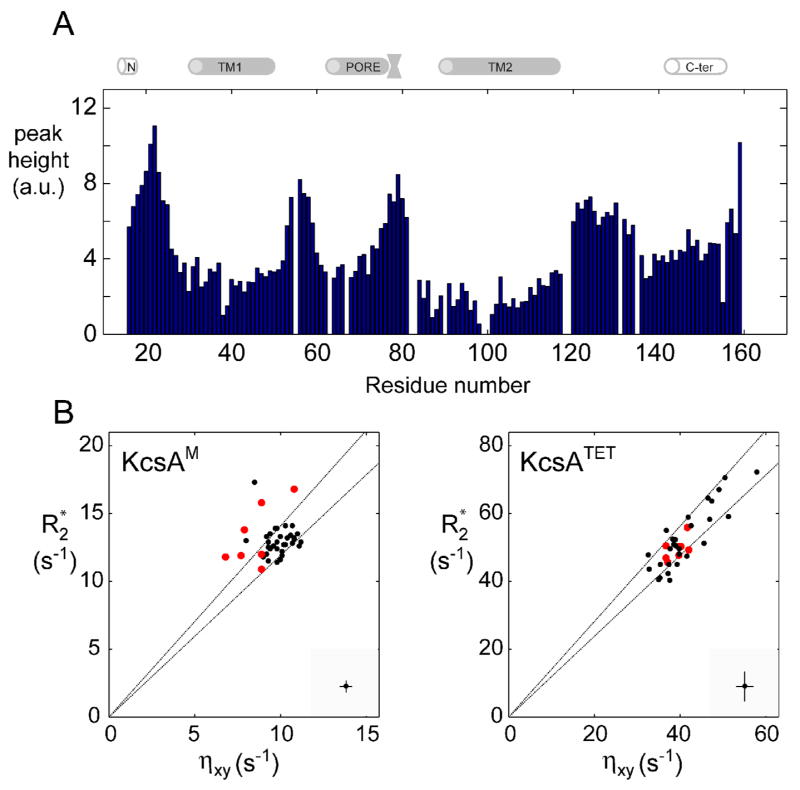
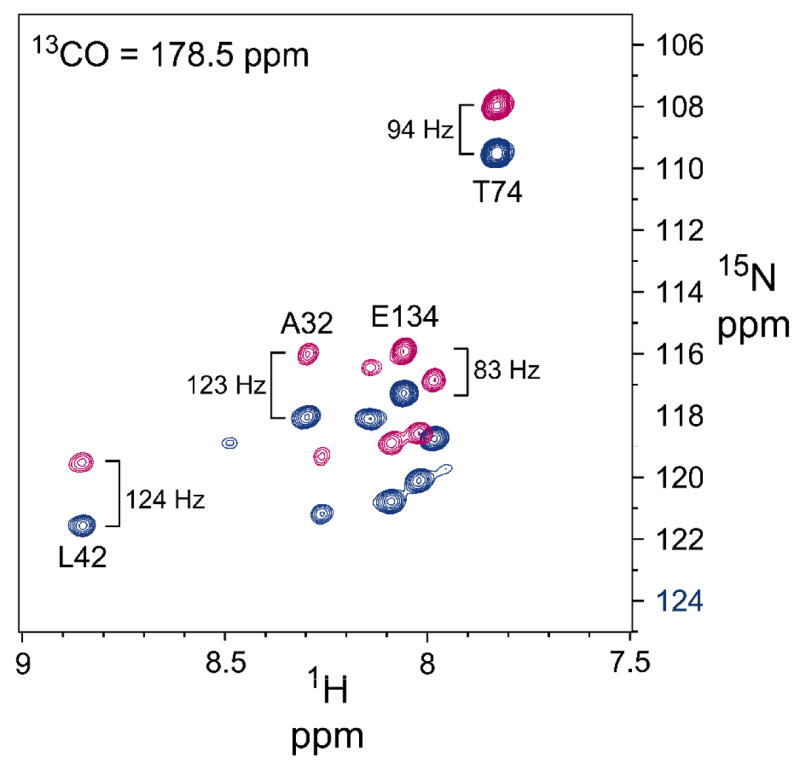
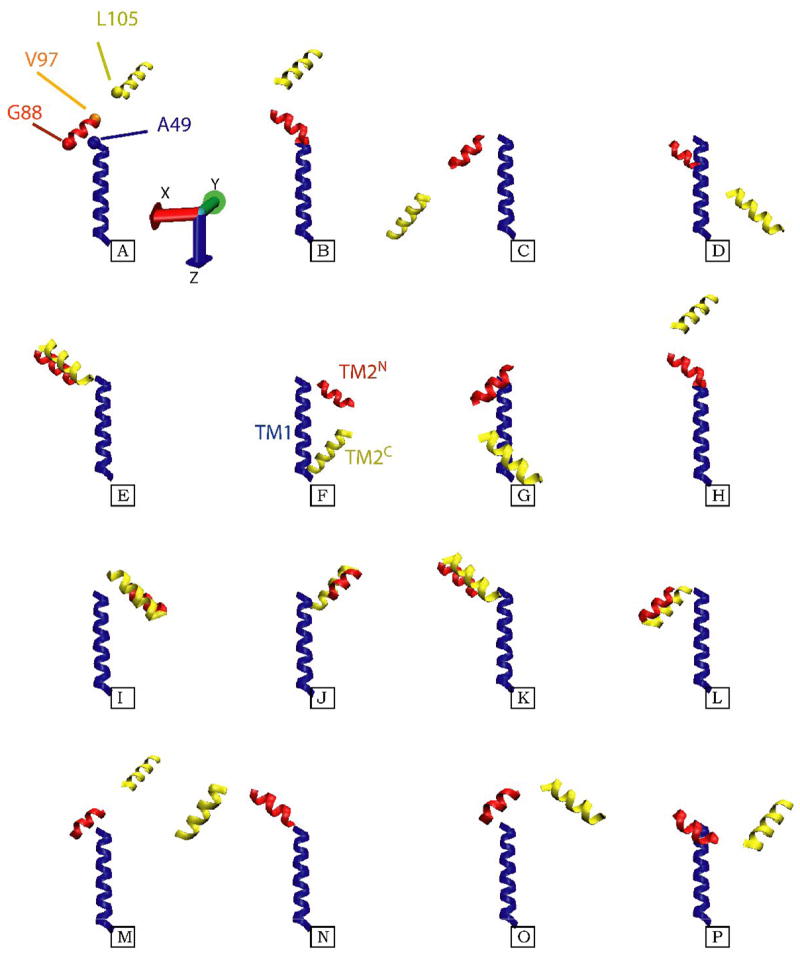
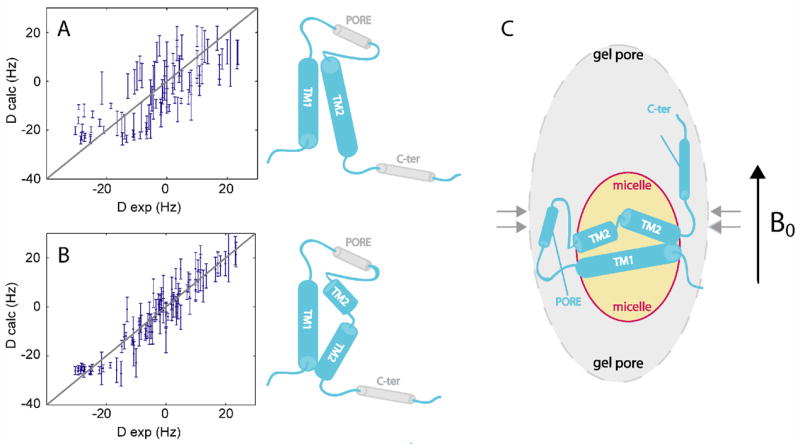
KcsA is a homotetrameric 68-kDa membrane-associated potassium channel which selectively gates the flux of potassium ions across the membrane. The channel is known to undergo a pH-dependent open-to-closed transition. Here we describe an NMR study of the monomeric subunit of the channel (KcsAM), solubilized in SDS micelles. Chemical shift, solvent exchange, backbone 15N relaxation and residual dipolar coupling (RDC) data show the TM1 helix to remain intact, but the TM2 helix contains a distinct kink, which is subject to concentration-independent but pH-dependent conformational exchange on a microsecond time scale. The kink region, centered at G99, was previously implicated in the gating of the tetrameric KcsA channel. An RDC-based model of KcsAM at acidic pH orients TM1 and the two helical segments of the kinked TM2 in a configuration reminiscent of the open conformation of the channel. Thus, the transition between states appears to be an inherent capability of the monomer, with the tetrameric assembly exerting a modulatory effect upon the transition which gives the channel its physiological gating profile.


Figures

Figure 1
Figure 1. Secondary structure in KcsAM vs KcsATET
Backbone chemical shifts of KcsAM were measured to determine secondary structure elements of the channel subunit and contrasted with the homotetrameric channel assembly. Secondary 13Cα shifts (corrected for 2H isotope effects) of (top) 0.6 mM [2H,13C,15N]-labeled KcsAM and (middle) 0.8 mM (monomeric concentration) [2H,13C,15N]-labeled KcsATET , both measured in 200 mM SDS and 25 mM MES pH 6.0 at 600 MHz and 323 K. Similar behavior is observed for the 13C′ secondary chemical shifts. (Bottom) Shown is a comparison of 1H and 15N chemical shifts between the above samples of KcsAM and KcsATET along the KcsA sequence. ΔNH is defined as sqrt[(ΔδH)2 + (ΔδN/5)2], with ΔδH and ΔδN representing the respective changes in 1H and 15N chemical shifts, and the uncertainty in ηNH is estimated to be ≤ 0.02 ppm. For non-proline residues, missing bars indicate unassigned residues for one of the KcsA forms. Note that ΔNH for residues 121–160 is ≤ 0.1 ppm. The cartoon above the figure delineates the positions of secondary structure elements as found in the KcsA crystal structure [2] and a previous NMR study [25].
Figure 2
Figure 2. pH-induced changes in KcsAM secondary structure
(A) Secondary 13Cα shifts (corrected for 2H isotope effects) measured at 600 MHz and 323 K of [2H,13C,15N]-labeled KcsAM in 200 mM SDS and (top) 25 mM sodium formate pH 4.2, and (middle) 20 mM Tris pH 8.0. Similar behavior is observed for the 13C′ secondary chemical shifts. (Bottom) Comparison of 1H and 15N chemical shifts between KcsAM samples at pH values of 4.2 and 8.0, with ΔNH defined as in Figure 1. For clarity, bars are shown only for residues with ΔNH ≥ 0.1 ppm. The cartoon above the figure delineates the positions of secondary structure elements as found in the KcsA crystal structure [2] and a previous NMR study [25]. (B) CD spectra of 15 μM samples of KcsAM in 15 mM SDS at various pH values. Curves obtained in 25 mM sodium formate pH 4.2, 25 mM MES pH 6.0, and 20 mM Tris pH 8.0 are shown in red, blue (practically overlapping) and green, respectively. Predicted helical contents are ~51% of residues for pH 4.2 and 6.0, compared to only 45% for pH 8.0.
Figure 3
Figure 3. Solvent exchange of backbone 1HN protons in KcsAM
Rates of exchange with solvent for KcsAM backbone amide protons were estimated by lyophilizing a 0.5 mM KcsAM sample in 200 mM SDS and 25 mM formate buffer, pH 4.2, and reconstituting in 99.9% D2O. Shown is a [1H,15N] tr-HSQC spectrum recorded 1 h after the sample was placed in a 600 MHz spectrometer at 323 K for the D2O sample. The total experiment time was 2 h. Visible peaks are labeled by residue number, with boxed labels showing no significant (<5%) change when compared to an identical spectrum recorded 7 hours later, and regular labels indicating peaks which were not visible or appreciably weakened in the second spectrum. Based upon these results, exchange rates at 323 K and pH 4.2 can be estimated as kex≤ 10−6 s−1 for the former and 10−6kex≤ 10−4 s−1 for the latter.
Figure 4
Figure 4. 15N backbone relaxation for KcsAM
15N backbone relaxation rates were measured at 600 MHz and 323 K for a 0.5 mM sample of [2H,13C,15N]-labeled KcsAM in 200 mM SDS and 25 mM MES pH 6.0. Spin-locked transverse relaxation R2 * values were derived from a measurement of R against a spin-lock field of 1.8 kHz with an appropriate correction for offset effects [35]. Relaxation rates for residues 36–40 in the TM1 helix were not measured for this sample due to insufficient back-exchange of solvent protons at these sample conditions. Measurements repeated at pH 8.0 (data not shown) establish that relaxation rates are uniform throughout the TM1 helix. The cartoon above the figure delineates the positions of secondary structure elements as found in the KcsA crystal structure [2] and a previous NMR study [25].
Figure 5
Figure 5. Conformational exchange on the intermediate time scale in the TM2 domain
(A) Intensity of tr-HNCO peaks (arbitrary units) along the KcsAM sequence. Spectrum was recorded at 600 MHz and 323 K for a 0.5 mM [2H,13C,15N]-labeled KcsAM in 200 mM SDS and 25 mM formate buffer at pH 4.2. The cartoon above the figure delineates the positions of secondary structure elements as found in the KcsA crystal structure [2] and a previous NMR study [25]. (B) A comparison of 1H, 15N-cross-correlated (ηxy) and transverse (R2*) relaxation rates (as described in Figure 4) for micelle-embedded residues at 600 MHz and 323 K for (left) a 0.5 mM sample of [2H,13C,15N]-labeled KcsAM in 200 mM SDS and 25 mM MES pH 6.0, and (right) a similar sample containing 0.6 mM of KcsATET. In the interest of clarity, typical errors in both parameters are shown at the bottom right corner of each diagram. The two lines indicate the upper and lower limits of the expected scatter of ηxy vs. R2 value assuming an average value of −170 ppm and a spread of ±30 ppm for the 15N chemical shift anisotropy. Values obtained for detectable residues in the TM2 helix segment 98AGITSFGLV107T are shown in red. Elevated R2/ ηxy ratios (points above the upper line) are characteristic of an exchange contribution to transverse relaxation. Note that KcsATETηxy and R2 values exhibit a wider spread due to the rotational diffusion anisotropy of the KcsA-loaded micelle and the inclusion of amide sites from the PORE helix, which is the least collinear with the four-fold symmetry axis.
Figure 6
Figure 6. Measurement of DNH residual dipolar couplings for KcsAM
DNH couplings were measured for a sample aligned in charged polyacrylamide gel (see text) containing 0.5 mM [2H,13C,15N]-labeled KcsAM in 200 mM SDS and 25 mM formate buffer at pH 4.2, acquired at 600 MHz and 323 K. The downfield (blue) and upfield (magenta) resonances of the 1H-coupled backbone 15N nuclei were obtained from an interleaved 3D tr-HNCO-based experiment as previously described [36]. Shown is a 1H,15N plane obtained for a 13CO frequency of 178.5 ppm, demonstrating the importance of 13CO-separation for obtaining well-resolved couplings. The |1 JNH+ 1 DNH| splittings of selected backbone 1H-15N sites are indicated, showing the opposite behavior of the TM1 (residues A32 and A42) and C-TER (residue E134) domains.
Figure 7
Figure 7. RDC-based models for the structure of SDS-solubilized KcsAM
Shown are the sixteen different models for the three TM helical segments of KcsAM, TM1 (blue), TM2N (red), and TM2C (yellow), which are compatible with the acquired RDC data. The TM1 helix is almost co-linear with the z-axis of the alignment frame, and its coordinates are maintained constant in all models. For the upper left structure, the positions of Cα atoms for residues L49, G88, V97, and L105 at the inter-helical ‘joints’ are shown as blue, red, orange and yellow spheres, respectively. Since the data provides no constraints on the translational relation between the three helical fragments, the models were created as follows: 1) The short six-residue linker (TM2K) which connects the two TM2 fragments was appended to each of them in a helical conformation, and the two virtual T101 Cα atoms were superimposed; 2) Since TM1 and TM2N are linked by a solvent-exposed helical segment, residues L49 and G88 have been located on the same side of the SDS micelle. The G88 Cα atom was placed in a plane perpendicular to TM1 and containing the L49 Cα atom, and 7 Å away from the TM1 helical axis. While the position of TM2 is still ill-defined in this procedure, the models shown aim to minimize the radius of gyration and create a relatively compact structure compatible with backbone 15N relaxation and light-scattering data. Of the sixteen possibilities, structures F and G provide the most compact arrangement of the helices, and the former is depicted in the cartoon in Figure 8.
Figure 8
Figure 8. Model of SDS-solubilized KcsAM
RDCs measured for the micelle-embedded helices of KcsAM were used to model this domain. (A) All 90 RDCs (normalized to DNH values) fitted to the structure of the monomeric subunit within the KcsATET structure (upper cartoon). (B) Same as (A), except the TM2 helix was allowed to bend at the kinked segment to optimize the fit between experimental and calculated RDC values, leading to a reduction in Q-factor from 0.67 to 0.35. The resulting model is shown (lower cartoon). (C) The RDC-based model of KcsAM embedded in an SDS micelle and aligned in a prolate polyacrylamide gel cavity.

Similar articles

Cited by

References

    1. Heginbotham L, Odessey E, Miller C. Tetrameric stoichiometry of a prokaryotic K+ channel. Biochemistry. 1997;36:10335–10342. - PubMed
    1. Doyle DA, Cabral JM, Pfuetzner RA, Kuo A, Gulbis JM, Cohen SL, Chait BT, Mackinnon R. The structure of the potassium channel: molecular basis of K+ conduction and selectivity. Science. 1998;280:69–77. - PubMed
    1. Lange A, Giller K, Hornig S, Martin-Eauclaire MF, Pongs O, Becker S, Baldus M. Toxin-induced conformational changes in a potassium channel revealed by solid-state NMR. Nature. 2006;440:959–962. - PubMed
    1. Yu LP, Sun CH, Song DY, Shen JW, Xu N, Gunasekera A, Hajduk PJ, Olejniczak ET. Nuclear magnetic resonance studies of a potassium channel-charybdotoxin complex. Biochemistry. 2005;44:15834–15841. - PubMed
    1. Cortes DM, Cuello LG, Perozo E. Molecular architecture of full-length KcsA: role of cytoplasmic domains in ion permeation and activation gating. J Gen Physiol. 2001;117:165–180. - PMC - PubMed

Publication types

LinkOut - more resources