. 2008 Jan 15;39(2):755-74.
doi: 10.1016/j.neuroimage.2007.08.020. Epub 2007 Aug 25.

Concordance between distributed EEG source localization and simultaneous EEG-fMRI studies of epileptic spikes

Affiliations

Concordance between distributed EEG source localization and simultaneous EEG-fMRI studies of epileptic spikes

C Grova et al. Neuroimage. .

Abstract

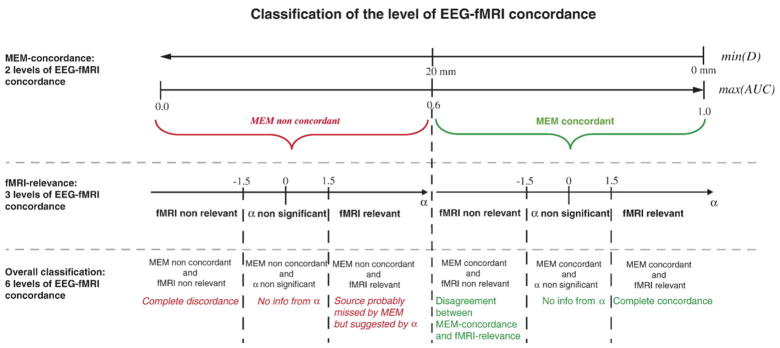
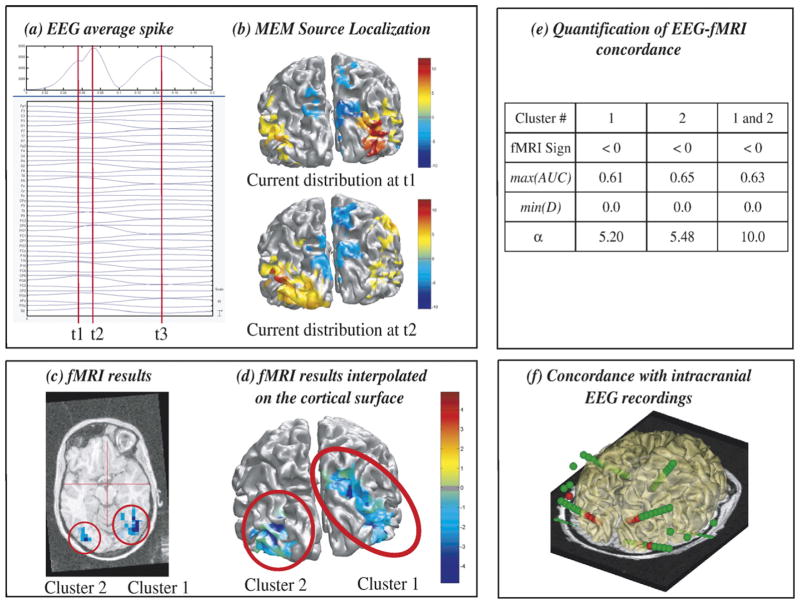
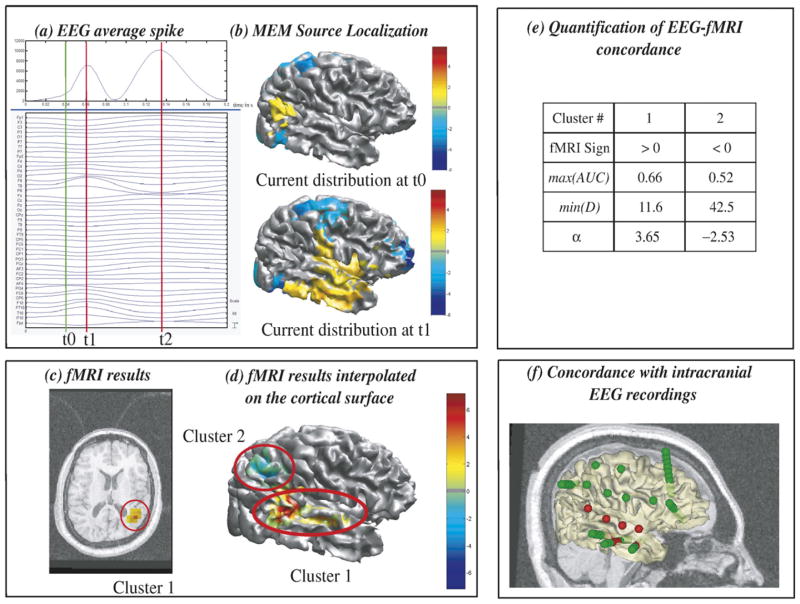
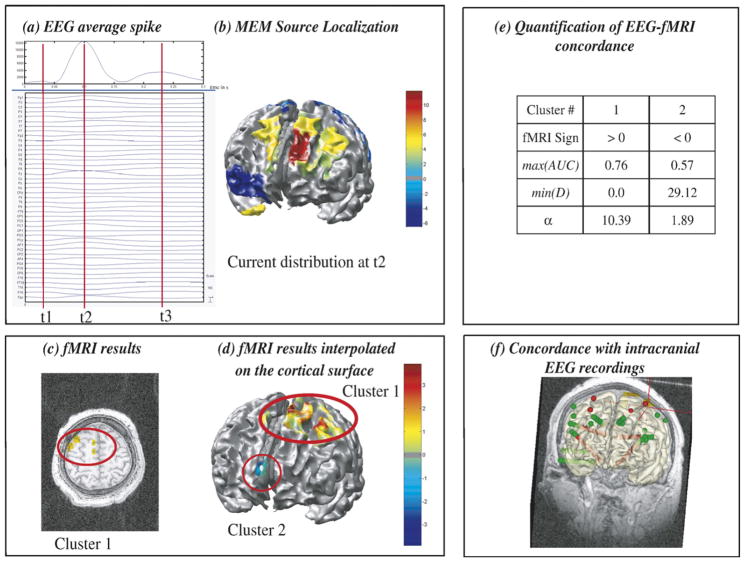
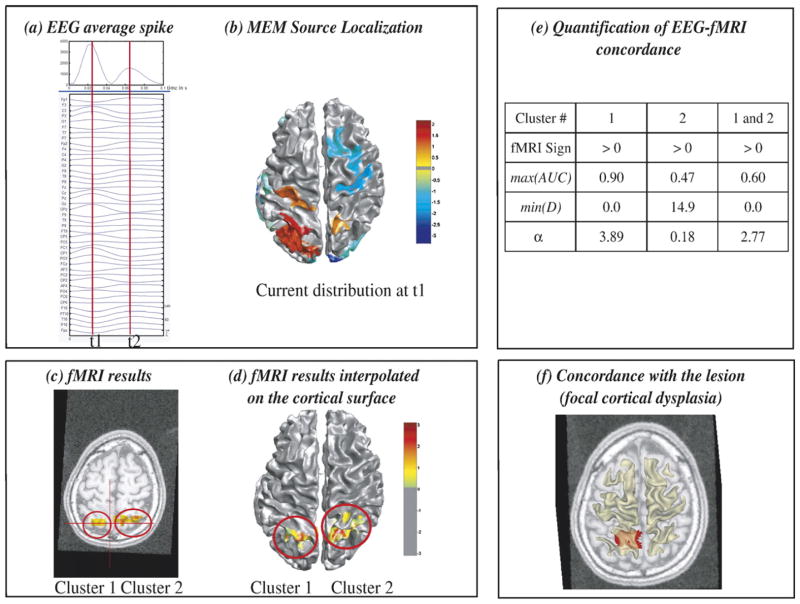
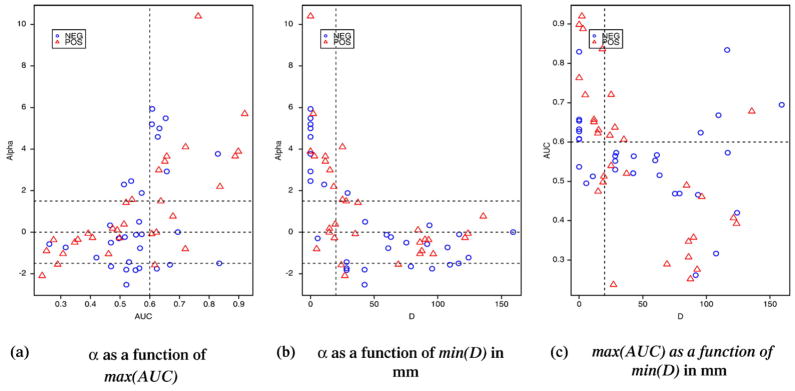
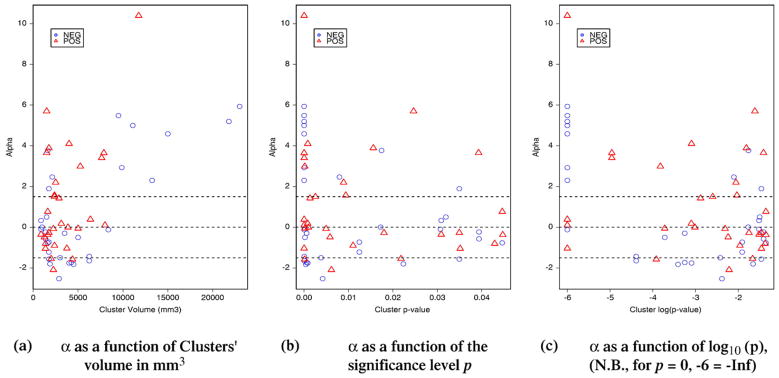
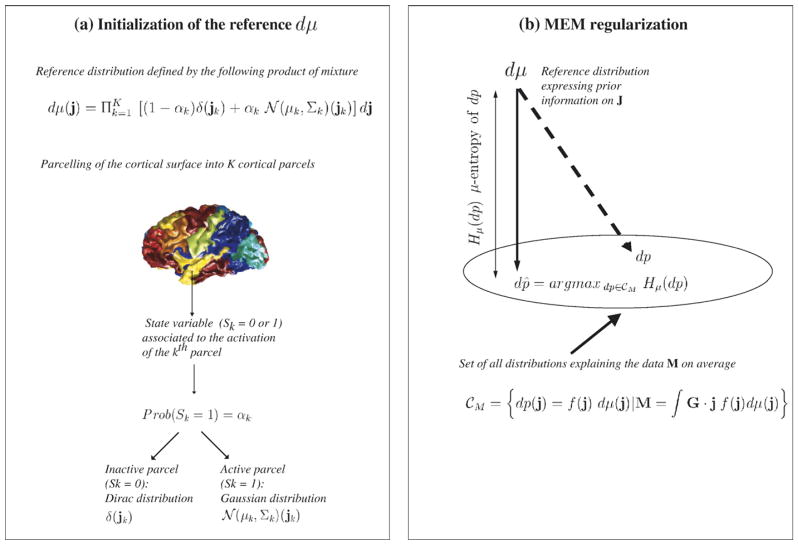
In order to analyze where epileptic spikes are generated, we assessed the level of concordance between EEG source localization using distributed source models and simultaneous EEG-fMRI which measures the hemodynamic correlates of EEG activity. Data to be compared were first estimated on the same cortical surface and two comparison strategies were used: (1) MEM-concordance: a comparison between EEG sources localized with the Maximum Entropy on the Mean (MEM) method and fMRI clusters showing a significant hemodynamic response. Minimal geodesic distances between local extrema and overlap measurements between spatial extents of EEG sources and fMRI clusters were used to quantify MEM-concordance. (2) fMRI-relevance: estimation of the fMRI-relevance index alpha quantifying if sources located in an fMRI cluster could explain some scalp EEG data, when this fMRI cluster was used to constrain the EEG inverse problem. Combining MEM-concordance and fMRI-relevance (alpha) indexes, each fMRI cluster showing a significant hemodynamic response (p<0.05 corrected) was classified according to its concordance with EEG data. Nine patients with focal epilepsy who underwent EEG-fMRI examination followed by EEG recording outside the scanner were selected for this study. Among the 62 fMRI clusters analyzed (7 patients), 15 (24%) found in 6 patients were highly concordant with EEG according to both MEM-concordance and fMRI-relevance. EEG concordance was found for 5 clusters (8%) according to alpha only, suggesting sources missed by the MEM. No concordance with EEG was found for 30 clusters (48%) and for 10 clusters (16%) alpha was significantly negative, suggesting EEG-fMRI discordance. We proposed two complementary strategies to assess and classify EEG-fMRI concordance. We showed that for most patients, part of the hemodynamic response to spikes was highly concordant with EEG sources, whereas other fMRI clusters in response to the same spikes were found distant or discordant with EEG sources.


Figures

Fig. 1
Fig. 1
Summary of the method to classify the six levels of EEG-fMRI concordance for each fMRI cluster according to MEM-concordance (min(D) and max (AUC)) and fMRI-relevance (α). For MEM concordant results, the interpretation of the corresponding classification according to α (fMRI non-relevant, α non-significant and fMRI relevant) is presented using green font. For MEM non-concordant results, the interpretation of the corresponding classification according to α(fMRI non-relevant, α non-significant and fMRI relevant) is presented using red italic font.
Fig. 2
Fig. 2
Analysis of patient 3 showing excellent EEG-fMRI concordance. (a) Signal and maximum field power of the average spike, local peaks (t1, t2, t3) considered for MEM-concordance are represented using red vertical lines. (b) MEM source localization estimated at t1 and t2, the positive and the negative parts of ĴMEM being thresholded upon the level of background activity, using Otsu’s threshold estimated on |ĴMEM| (Otsu, 1979). (c) t-values of the two most significant fMRI clusters obtained with the HRF peaking 5 s after the spike, superimposed on the 3D anatomical MRI. (d) Same fMRI clusters after interpolation onto the cortical surface. (e) MEM-concordance and fMRI-relevance metrics for cluster 1, cluster 2 and when considering both clusters together. (f) 3D representation of the position of the intracranial EEG electrodes with one MRI axial slice and the cortical surface (yellow slightly transparent), active contacts being represented in red. Visual inspection (b and d) and quantitative results (e) showed an excellent EEG-fMRI concordance within right and left occipital regions, and were confirmed by intracranial EEG recordings (f).
Fig. 3
Fig. 3
Analysis of patient 1 suggesting EEG-fMRI concordance during spike propagation. (a) Signal and maximum field power of the average spike, local peaks (t1, t2) considered for MEM-concordance are represented using red vertical lines. (b) MEM source localization, thresholded as in Fig. 2b, estimated at t1 and t0, an additional time point showing some early activity located at PO4 electrode (green vertical line in panel a) and in the right superior posterior temporal area on the cortex. (c) t-values of the two most significant fMRI clusters obtained with the HRF peaking 5 s after the spike, superimposed on the 3D anatomical MRI. (d) Same fMRI clusters after interpolation onto the cortical surface. (e) MEM-concordance and fMRI-relevance metrics for cluster 1 and cluster 2. (f) 3D representation of the position of the intracranial EEG electrodes with one MRI sagittal slice and the cortical surface (yellow slightly transparent), active contacts being represented in red. Comparisons between fMRI and MEM results at t1 suggested partial spatial overlap between sources. α=3.65 for cluster 1 suggested a good EEG-fMRI concordance, which could be slightly detectable in MEM results at t0. These results were confirmed by intracranial EEG recordings (f).
Fig. 4
Fig. 4
Analysis of patient 8 showing partial EEG-fMRI concordance. (a) Signal and maximum field power of the average spike, local peaks (t1, t2, t3) considered for MEM-concordance are represented using red vertical lines. (b) MEM source localization, thresholded as in Fig. 2b, estimated at the main peak of the spike t2. (c) t-values of the two most significant fMRI clusters obtained with the HRF peaking 5s after the spike, superimposed on the 3D anatomical MRI. (d) Same fMRI clusters after interpolation onto the cortical surface. (e) MEM-concordance and fMRI-relevance metrics for cluster 1 and cluster 2. (f) 3D representation of the position of the intracranial EEG electrodes with one MRI coronal slice and the cortical surface (yellow slightly transparent), active contacts being represented in red. EEG source localization, fMRI and intracranial EEG results showed a complex and widespread distribution of the activity involved at the time of the spike. However, excellent EEG-fMRI concordance was found within a widespread left frontal source (fMRI cluster 1). No MEM source was found concordant with the right anterior cingulate BOLD deactivation (cluster 2), although α=1.89 suggested that sources located in this region could explain some scalp EEG data, which was confirmed by intracranial EEG results (f).
Fig. 5
Fig. 5
Analysis of patient 9 showing partial EEG-fMRI concordance within a focal cortical dysplasia. (a) Signal and maximum field power of the average spike, local peaks (t1, t2) considered for MEM-concordance are represented using red vertical lines. (b) MEM source localization estimated at t1, thresholded as in Fig. 2b. (c) t-values of the two most significant fMRI clusters obtained with the HRF peaking 3 s after the spike, superimposed on the 3D anatomical MRI. (d) Same fMRI clusters after interpolation onto the cortical surface. (e) MEM-concordance and fMRI-relevance metrics for cluster 1, cluster 2 and when considering both clusters together. (f) Left parietal focal cortical dysplasia manually segmented and superimposed in red on an axial MRI slice, together with the cortical surface (yellow slightly transparent). Visual inspection (b and d) and quantitative results (e) confirmed an excellent EEG-fMRI concordance within the dysplastic lesion (f). α suggested that considering only cluster 1 as prior information in the EEG inverse problem was more relevant than considering both cluster 1 and cluster 2.
Fig. 6
Fig. 6
Distributions of MEM-concordance (min(D) and max(AUC)) and fMRI-relevance (α) metrics for all the 62 clusters considered in this study. Clusters corresponding to activations are represented in red triangles, and deactivations in blue circles. Thresholds used for classification are displayed using dashed lines. There is overall a good agreement between α, min(D) and max(AUC) and they are uniformly distributed over their whole range of values. In most cases, fMRI-relevance was then in agreement with MEM-concordance and all levels of EEG-fMRI concordance were observed. More discrepancies were observed between max(AUC) and min(D), especially for highest min(D) values (c), suggesting that these two metrics were complementary and necessary to quantify MEM-concordance.
Fig. 7
Fig. 7
Distribution of the fMRI-relevance index α as a function of: (a) the volume of each cluster, (b) the corrected significance level of the cluster p and (c) its logarithm log10(p). Each point corresponds to one of the 62 clusters considered in this study. Clusters corresponding to activations are represented in red triangles, and deactivations in blue circles. Thresholds used for classification are displayed using dashed lines. Almost all the largest fMRI clusters (volume>10 mm3) were highly relevant for EEG source localization (α>1.5). The fMRI responses concordant with EEG were either activation or deactivation, also fMRI clusters showing deactivation tend to be slightly larger than the ones showing activations (a).
Fig. 8
Fig. 8
Principle of source localization using MEM principle: (a) definition of the reference distribution expressing prior information on J, (b) principle of MEM regularization, estimation of the solution dp̂ explaining the data M in average with maximum μ-entropy. dp̂ is the distribution explaining the data M in average closest to in the sense of Kullback–Leibler divergence.
Fig. 9
Fig. 9
Graph representation of the hierarchical linear model of data generation and description of three levels of Bayesian inference used to estimate the evidence of any prior model Hi.

Similar articles

Cited by

References

    1. Al-Asmi A, Bénar C, Gross D, Aghakhani Y, Andermann F, Pike B, Dubeau F, Gotman J. fMRI activation in continuous and spike-triggered EEG-fMRI studies of epileptic spikes. Epilepsia. 2003;44 (10):1328–1339. - PubMed
    1. Alarcon G, Guy C, Walker S, Elwes R, Polkey C. Intracerebral propagation of interictal activity in partial epilepsy: implications for source localization. J Neurol, Neurosurg Psychiatry. 1994;57:435–449. - PMC - PubMed
    1. Amblard C, Lapalme E, Lina JM. Biomagnetic cortical sources resconstruction by maximum entropy on the mean. IEEE Trans Biomed Eng. 2004;51(3):427–442. - PubMed
    1. Andrade A, Kherif F, Mangin JF, Worsley K, Paradis A, Simon O, Dehaene S, Le Bihan D, Poline JB. Detection of fMRI activation using cortical surface mapping. Hum Brain Mapp. 2001;12:79–93. - PMC - PubMed
    1. Archer J, Briellmann R, Syngeniotis A, Abbott D, Jackson G. Spike-triggered fMRI in reading epilepsy: involvement of left frontal cortex working memory area. Neurology. 2003;60 (3):415–421. - PubMed

MeSH terms

Grants and funding