. 2007 Dec;177(4):2161-9.
doi: 10.1534/genetics.107.082206. Epub 2007 Oct 18.

Linkage disequilibrium in related breeding lines of chickens

Affiliations

Linkage disequilibrium in related breeding lines of chickens

Cristina Andreescu et al. Genetics. 2007 Dec.

Abstract

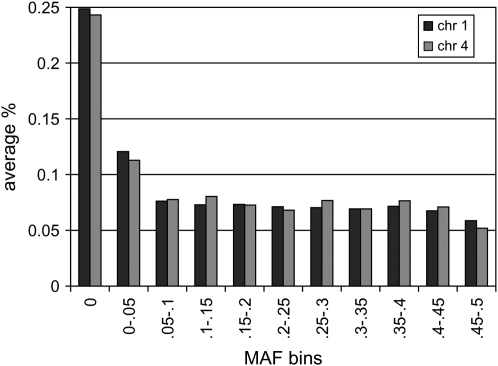
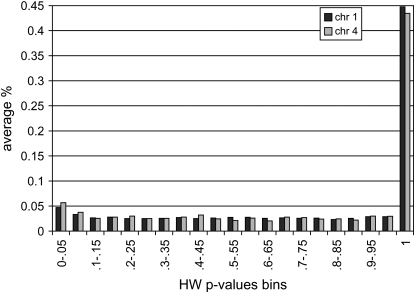
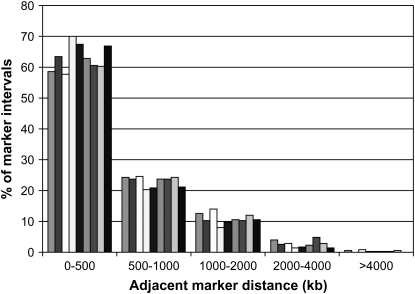
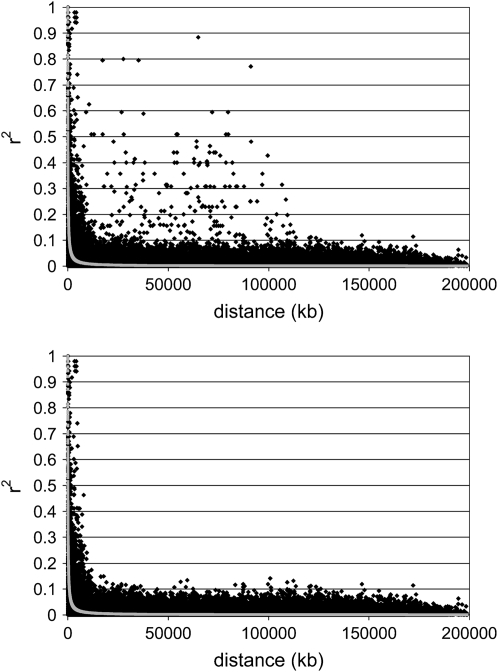
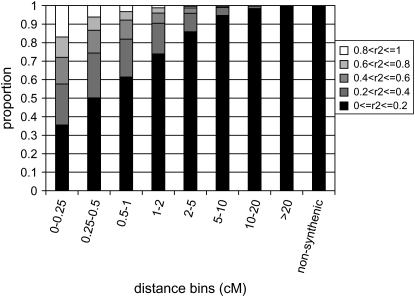
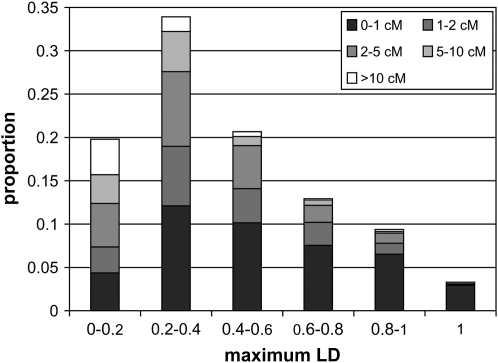
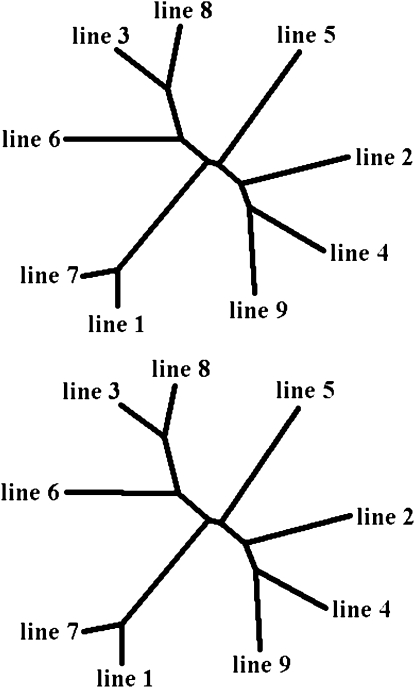
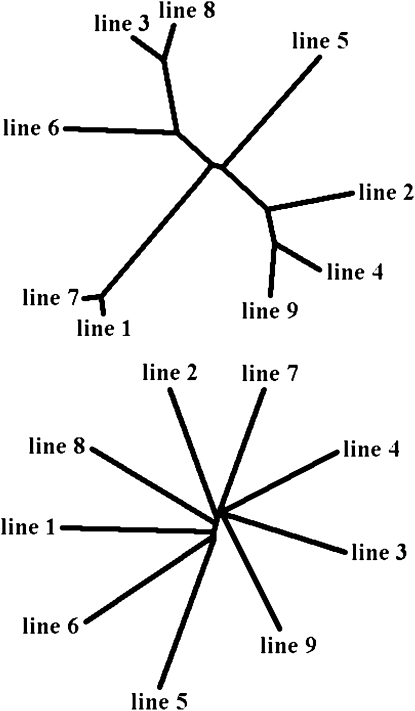
High-density genotyping of single-nucleotide polymorphisms (SNPs) enables detection of quantitative trait loci (QTL) by linkage disequilibrium (LD) mapping using LD between markers and QTL and the subsequent use of this information for marker-assisted selection (MAS). The success of LD mapping and MAS depends on the extent of LD in the populations of interest and the use of associations across populations requires LD between loci to be consistent across populations. To assess the extent and consistency of LD in commercial broiler breeding populations, we used genotype data for 959 and 398 SNPs on chromosomes 1 and 4 on 179-244 individuals from each of nine commercial broiler chicken breeding lines. Results show that LD measured by r(2) extends over shorter distances than reported previously in other livestock breeding populations. The LD at short distance (within 1 cM) tended to be consistent across related populations; correlations of LD measured by r for pairs of lines ranged from 0.17 to 0.94 and closely matched the line relationships based on marker allele frequencies. In conclusion, LD-based correlations are good estimates of line relationships and the relationship between a pair of lines a good predictor of LD consistency between the lines.


Figures

F<sc>igure</sc> 1.—
Figure 1.—
Frequency distribution of major allele frequencies of markers on chromosomes 1 and 4 across lines. The frequency on the vertical axis is the average of within-line frequencies. Similar distributions were obtained for individual lines.
F<sc>igure</sc> 2.—
Figure 2.—
Distribution of P-values for deviations from Hardy–Weinberg equilibrium for markers on chromosomes 1 and 4 across lines. The frequency on the vertical axis is the average of within-line frequencies. Similar distributions were obtained for individual lines.
F<sc>igure</sc> 3.—
Figure 3.—
Distribution of the distance between adjacent markers in each line.
F<sc>igure</sc> 4.—
Figure 4.—
Decline of linkage disequilibrium (LD) measured by r2 against distance in kilobases. Data are for chromosome 1 and line 2, before (left) and after (right) elimination of the two markers most involved in high long-distance LD. Chromosome 4 had a similar pattern of decline but lacked high long-range LD. The graphs combine two different aspects of LD vs. distance: a scatterplot of estimates of r2 for pairs of SNPs (solid symbols) and a predicted LD value plot (shaded symbols) based on fitting the equation E(r2) = 1/(1 + 4 × Ne × d), where Ne is the effective population size and d is the distance in morgans (assuming 2.8 cM/Mb). We ignored the sample size correction of +1/n, where n is the number of haplotypes, as it is negligible due to large sample size.
F<sc>igure</sc> 5.—
Figure 5.—
Frequency distribution of estimates of LD by r2 for syntenic and nonsyntenic marker pairs. The syntenic distribution was computed across chromosomes and lines, within between-marker distance bins. The nonsyntenic distribution was computed across lines. Similar distributions were obtained within lines and chromosomes. Distances, in centimorgans, are computed from the base pair distance by multiplying with the average centimorgan per base pair distance across the chicken genome.
F<sc>igure</sc> 6.—
Figure 6.—
Frequency of maximum LD of SNPs based on r2, across lines and chromosomes. Bins were created on the basis of distance to the SNP for which the maximum LD was registered. A similar distribution was observed for each chromosome separately.
F<sc>igure</sc> 7.—
Figure 7.—
Phylogenetic trees based on marker allele frequencies for chromosome 1 (top) and chromosome 4 (bottom). Trees were obtained using the UPGMA algorithm.
F<sc>igure</sc> 8.—
Figure 8.—
Phylogenetic trees based on covariances of LD estimated by r between lines for pairs of markers within 500 kb (top) and for nonsyntenic pairs (bottom). Trees were obtained using the UPGMA algorithm.

References

    1. Abasht, B., and S. J. Lamont, 2007. Genome-wide association analysis reveals cryptic alleles as an important factor in heterosis for fatness in chicken F2 population. Anim. Genet. 38: 491–498. - PubMed
    1. Ardlie, K. G., L. Kruglyak and M. Seielstad, 2002. Patterns of linkage disequilibrium in the human genome. Nat. Rev. Genet. 3: 299–309. - PubMed
    1. Barrett, J. C., B. Fry, J. Maller and M. J. Daly, 2005. Haploview: analysis and visualization of LD and haplotype maps. Bioinformatics 21: 263–265. - PubMed
    1. Dekkers, J. C. M., 2004. Commercial application of marker- and gene-assisted selection in livestock: strategies and lessons. J. Anim. Sci. 82(E-Suppl.): E313–328. - PubMed
    1. Du, F.-X., A. C. Clutter and M. M. Lohuis, 2007. Characterizing linkage disequilibrium in pig populations. Int. J. Biol. Sci. 3: 166–178. - PMC - PubMed

Publication types