. 2007 Nov;177(3):1743-51.
doi: 10.1534/genetics.107.079558. Epub 2007 Oct 18.

Evolution of fitnesses and allele frequencies in a population with spatially heterogeneous selection pressures

Affiliations

Evolution of fitnesses and allele frequencies in a population with spatially heterogeneous selection pressures

Bastiaan Star et al. Genetics. 2007 Nov.

Abstract

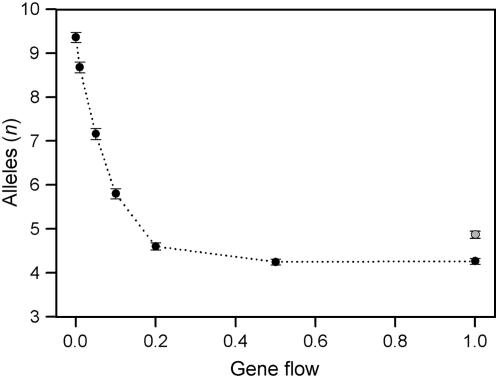
The level of gene flow considerably influences the outcome of evolutionary processes in structured populations with spatial heterogeneity in selection pressures; low levels of gene flow may allow local adaptation whereas high levels of gene flow may oppose this process thus preventing the stable maintenance of polymorphism. Indeed, proportions of fitness space that successfully maintain polymorphism are substantially larger in spatially heterogenous populations with lower to moderate levels of gene flow when compared to single-deme models. Nevertheless, the effect of spatial heterogeneity on the evolutionary construction of polymorphism is less clear. We have investigated the levels of polymorphism resulting from a simple two-deme construction model, which incorporates recurrent mutation as well as selection. We further compared fitness properties, stability of equilibria, and frequency distribution patterns emerging from the construction approach and compared these to the static fitness-space approach. The construction model either promotes or constrains the level of polymorphisms, depending on the levels of gene flow. Comparison of the fitness properties resulting from both approaches shows that they maintain variation in different parts of fitness space. The part of fitness space resulting from construction is more stable than that implied by the ahistoric fitness-space approach. Finally, the equilibrium allele-frequency distribution patterns vary substantially with different levels of gene flow, underlining the importance of correctly sampling spatial structure if these patterns are to be used to estimate population-genetic processes.


Figures

F<sc>igure</sc> 1.—
Figure 1.—
The average number of alleles (n) maintained after 10,000 generations as a function of gene flow in the two-deme model. The shaded symbol indicates the result for the single-deme model. The error bars are 95% confidence intervals. Gene flow has a strong significant (single-factor ANOVA, F7,7992 = 1569, P < 0.0001) effect on the average number of alleles maintained. Data from the single-deme model were added as an additional level to the factor.
F<sc>igure</sc> 2.—
Figure 2.—
Levels of heterozygote advantage (formula image) as a function of gene flow (m) for fitness sets containing n alleles after 10,000 generations. The shaded symbols indicate the results for the single-deme model whereas the open symbols indicate those for the fitness-space approach (see text for explanation). Standard errors are very small and are omitted for clarity. The dashed line indicates zero heterozygote advantage, which is the average for randomly generated fitnesses. Gene flow (m) and the number of alleles (n) have a significant interaction effect (ANCOVA, F7,7914 = 134, P ≤ 0.0001, m as factor, n as covariate) on formula image.
F<sc>igure</sc> 3.—
Figure 3.—
Pearson's correlation coefficients (ρ) between two demes for fitness values as a function of gene flow (m) for fitness sets with n ≥ 2. The error bars are standard error intervals. The dashed line indicates zero correlation, which is the average for randomly generated sets of fitnesses. The open symbols indicate the results for the fitness space approach (see text for explanation). Gene flow (m) and the number of alleles (n) have a significant interaction effect (ANCOVA, F6,6924 = 34.1, P ≤ 0.0001, m as factor, n as covariate) on ρ.
F<sc>igure</sc> 4.—
Figure 4.—
The square root of the number of invasions (circles, left y-axis) and the square root of the ratio of long-/short-term mutants (triangles, right y-axis) as a function of gene flow. The shaded symbols indicate the results for the single-deme model. The error bars are 95% confidence intervals. Gene flow has a strong significant effect on the number of invasions (single-factor ANOVA, F7,7992 = 1350, P ≤ 0.0001) and the ratio of long-/short-term mutants (single-factor ANOVA, F7,7992 = 589, P ≤ 0.0001). Both responses were square-root transformed to comply with the ANOVA assumption of homoscedasticity of residuals.
F<sc>igure</sc> 5.—
Figure 5.—
Size of domain of attraction measured by the proportion of initial allele-frequency vectors leading to fully polymorphic equilibrium as a function of gene flow for type II fitness sets. The error bars are standard error intervals. For the construction model, gene flow has a significant (Kruskal–Wallis, formula image = 182, P < 0.0001) effect on the size of domain of attraction.
F<sc>igure</sc> 6.—
Figure 6.—
Distribution of allele-frequency vectors measured by the square root of index I for n alleles as a function of gene flow (m). The index I was calculated using allele frequencies from one of the demes (black symbols), pooled frequencies from both demes (white symbols) and frequencies from a single deme (gray symbols). The red symbols indicate the results for the fitness-space approach (see text for explanation). The error bars are standard error intervals. For the construction model, m and n have a significant interaction effect (ANCOVA, F7, 7914 = 4.69, P ≤ 0.0001, m as factor, n as covariate) on the single index I. For the pooled index I, no significant interaction effect was detected. Both m (F7,7921 = 108, P ≤ 0.0001) and n (F1,7921 = 109, P ≤ 0.0001) have a significant effect on the pooled index I. Both indexes were square-root transformed to comply with the ANCOVA assumption of normality of residuals.
F<sc>igure</sc> 7.—
Figure 7.—
Proportion of simulations with allele-frequency vectors that were significantly different from neutrality as a function of gene flow. Samples were taken from one of the demes (triangles) and from pooled frequency vectors from both demes (circles). Frequency vectors were rejected if ≥18 of the generated sample homozygosity (formula image) values were lower (solid symbols) or higher (open symbols) than the critical points of Ewens' sampling distribution (see text for explanation).

References

    1. Bulmer, M. G., 1972. Multiple niche polymorphism. Am. Nat. 106: 254–257.
    1. Ewens, W. J., 1972. Sampling theory of selectively neutral alleles. Theor. Popul. Biol. 3: 87–112. - PubMed
    1. Felsenstein, J., 1976. The theoretical population genetics of variable selection and migration. Annu. Rev. Genet. 10: 253–280. - PubMed
    1. Gillespie, J. H., 1991. The Causes of Molecular Evolution. Oxford University Press, New York.
    1. Gillespie, J. H., 1997. Junk ain't what junk does: neutral alleles in a selected context. Gene 205: 291–299. - PubMed

Publication types