

Genetic analyses of a hybrid cross between serotypes A and D strains of the human pathogenic fungus Cryptococcus neoformans
- PMID: 17947421
- PMCID: PMC2147976
- DOI: 10.1534/genetics.107.078923
Genetic analyses of a hybrid cross between serotypes A and D strains of the human pathogenic fungus Cryptococcus neoformans
Abstract
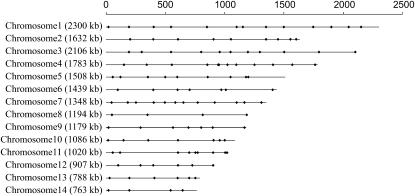
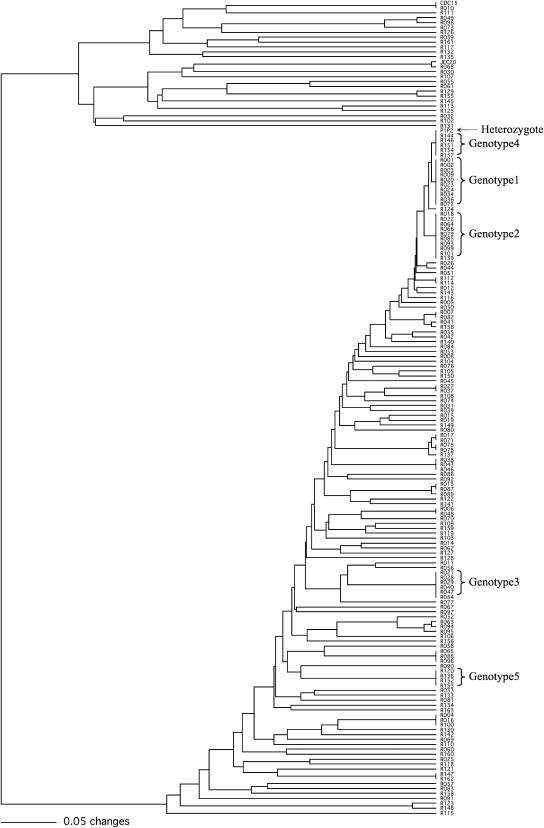
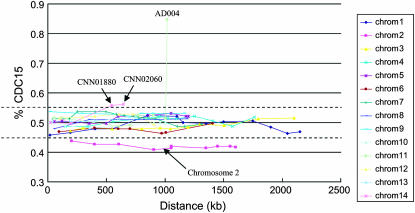
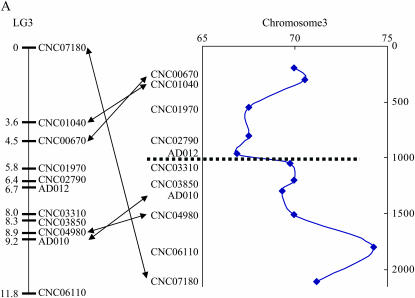
Cryptococcus neoformans has two varieties, var. grubii and var. neoformans, that correspond to serotypes A and D, respectively. Molecular phylogenetic analyses suggest that these two varieties have diverged from each other for approximately 18 million years. The discovery of pathogenic serotype AD hybrid strains in nature indicates that intervariety mating in C. neoformans occurs in the natural environment. However, little is known about the genetic consequences of hybridization in C. neoformans. Here, we analyzed a hybrid population of 163 progeny from a cross between strains of serotypes A (CDC15) and D (JEC20), using 114 codominant nuclear PCR-RFLP markers and 1 direct PCR marker. These markers were distributed on all 14 chromosomes of the sequenced strain JEC21 that was isogenic to one of the parents (JEC20) in our cross. Our analyses identified that of the 163 progeny, 5 were heterozygous at all 115 loci, 1 was completely homozygous and identical to one of the parents (CDC15), and the remaining 157 each contained at least 1 heterozygous locus. Because all 163 progeny inherited mitochondria from the MATa parent JEC20, none of the progeny had a genotype identical to either of the two parents or to a composite of the two parents. All 115 nuclear loci showed three different genotypes in the progeny population, consistent with Mendelian segregation during meiosis. While the linkage analysis showed independent reassortment among loci on different linkage groups, there were significant differences in recombination frequencies among chromosomes and among regions within certain chromosomes. Overall, the linkage-map length from this hybrid cross was much shorter and the recombination frequency much lower than those constructed using serotype D strains, consistent with suppressed recombination in the intervariety cross between strains of serotypes A and D. We discuss the implications of our results in our understanding of the speciation and evolution of the C. neoformans species complex.
Figures
Similar articles
-
Chromosomal rearrangements between serotype A and D strains in Cryptococcus neoformans.PLoS One. 2009;4(5):e5524. doi: 10.1371/journal.pone.0005524. Epub 2009 May 13. PLoS One. 2009. PMID: 19436753 Free PMC article.
-
Many globally isolated AD hybrid strains of Cryptococcus neoformans originated in Africa.PLoS Pathog. 2007 Aug 17;3(8):e114. doi: 10.1371/journal.ppat.0030114. PLoS Pathog. 2007. PMID: 17708680 Free PMC article.
-
Molecular genetic analyses of mating pheromones reveal intervariety mating or hybridization in Cryptococcus neoformans.Infect Immun. 2002 Sep;70(9):5225-35. doi: 10.1128/IAI.70.9.5225-5235.2002. Infect Immun. 2002. PMID: 12183574 Free PMC article.
-
Physical maps for genome analysis of serotype A and D strains of the fungal pathogen Cryptococcus neoformans.Genome Res. 2002 Sep;12(9):1445-53. doi: 10.1101/gr.81002. Genome Res. 2002. PMID: 12213782 Free PMC article.
-
Molecular analyses of the serotype of Cryptococcus neoformans.Nihon Ishinkin Gakkai Zasshi. 2001;42(2):69-74. doi: 10.3314/jjmm.42.69. Nihon Ishinkin Gakkai Zasshi. 2001. PMID: 11331466 Review.
Cited by
-
Unisexual reproduction drives meiotic recombination and phenotypic and karyotypic plasticity in Cryptococcus neoformans.PLoS Genet. 2014 Dec 11;10(12):e1004849. doi: 10.1371/journal.pgen.1004849. eCollection 2014 Dec. PLoS Genet. 2014. PMID: 25503976 Free PMC article.
-
A High-Resolution Map of Meiotic Recombination in Cryptococcus deneoformans Demonstrates Decreased Recombination in Unisexual Reproduction.Genetics. 2018 Jun;209(2):567-578. doi: 10.1534/genetics.118.300996. Epub 2018 Apr 6. Genetics. 2018. PMID: 29625994 Free PMC article.
-
Identification of QTLs Associated with Virulence Related Traits and Drug Resistance in Cryptococcus neoformans.G3 (Bethesda). 2016 Sep 8;6(9):2745-59. doi: 10.1534/g3.116.029595. G3 (Bethesda). 2016. PMID: 27371951 Free PMC article.
-
On the evolution of variation in sexual reproduction through the prism of eukaryotic microbes.Proc Natl Acad Sci U S A. 2023 Mar 7;120(10):e2219120120. doi: 10.1073/pnas.2219120120. Epub 2023 Mar 3. Proc Natl Acad Sci U S A. 2023. PMID: 36867686 Free PMC article. Review.
-
The Pheromone and Pheromone Receptor Mating-Type Locus Is Involved in Controlling Uniparental Mitochondrial Inheritance in Cryptococcus.Genetics. 2020 Mar;214(3):703-717. doi: 10.1534/genetics.119.302824. Epub 2019 Dec 30. Genetics. 2020. PMID: 31888949 Free PMC article.
References
-
- Alspaugh, J. A., R. C. Davidson and J. Heitman, 2000. Morphogenesis of Cryptococcus neoformans, pp. 217–238 in Dimorphism in Human Pathogenic and Apathogenic Yeasts, edited by J. F. Ernst and A. Schmidt. Karger, Basel, Switzerland. - PubMed
-
- Barchiesi, F., M. Cogliati, M. C. Esposto, E. Spreghini, A. M. Schimizzi et al., 2005. Comparative analysis of pathogenicity of Cryptococcus neoformans serotypes A, D and AD in murine cryptococcosis. J. Infect. 51: 10–16. - PubMed
-
- Boekhout, T., B. Theelen, M. Diaz, J. W. Fell, W. C. J. Hop et al., 2001. Hybrid genotypes in the pathogenic yeast Cryptococcus neoformans. Microbiology 147: 891–907. - PubMed
Publication types
MeSH terms
Substances
LinkOut - more resources
Full Text Sources
