. 2007 Dec;177(4):2309-19.
doi: 10.1534/genetics.107.076679. Epub 2007 Oct 18.

Detection of quantitative trait Loci influencing recombination using recombinant inbred lines

Affiliations

Detection of quantitative trait Loci influencing recombination using recombinant inbred lines

Jefferey Dole et al. Genetics. 2007 Dec.

Abstract

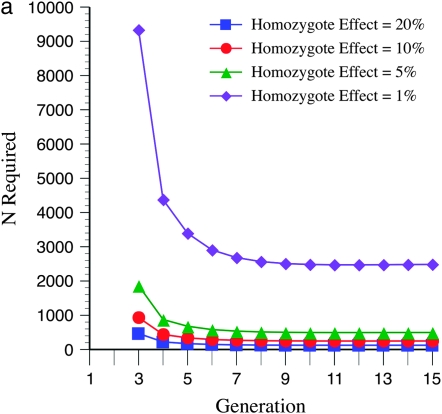
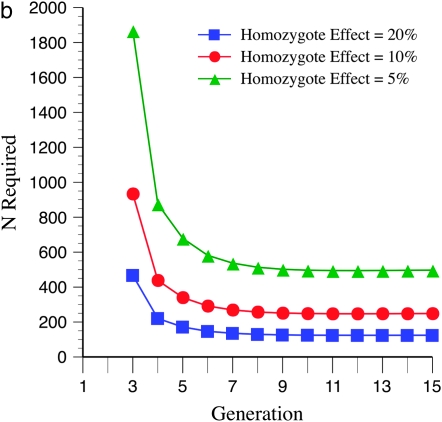
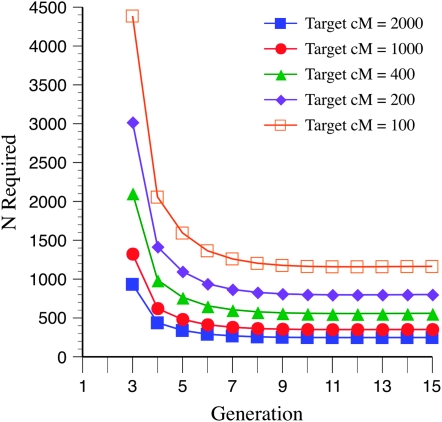
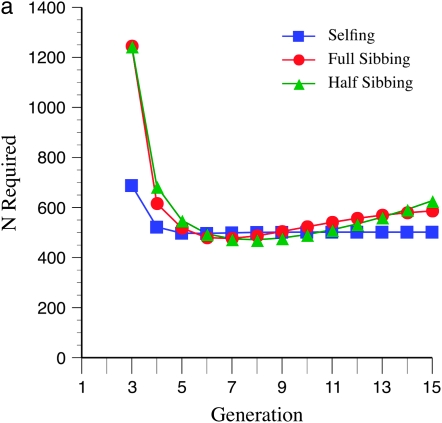
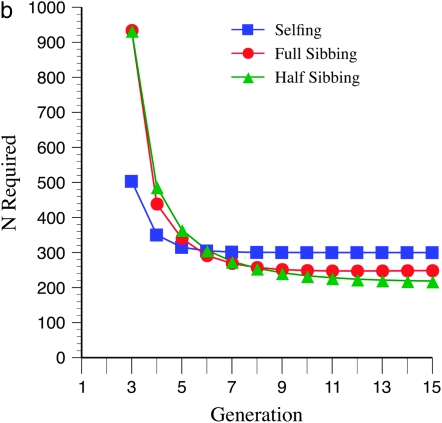
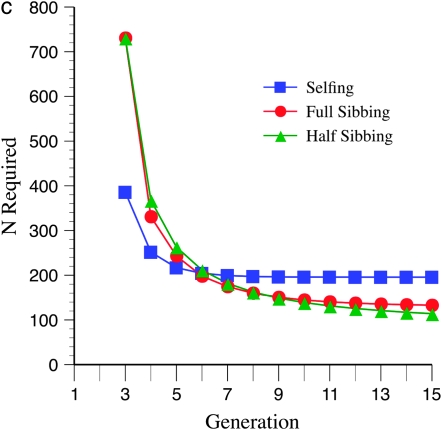
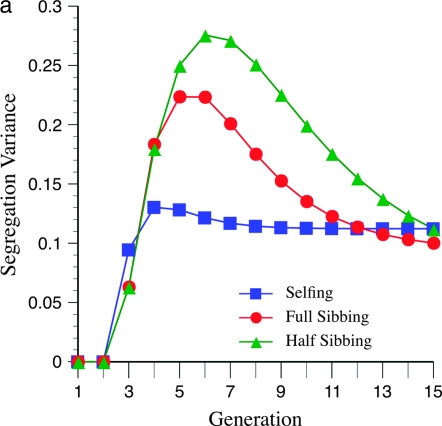
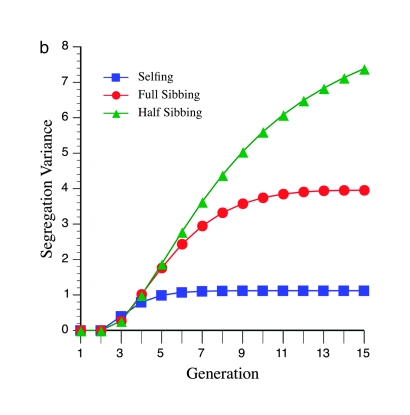
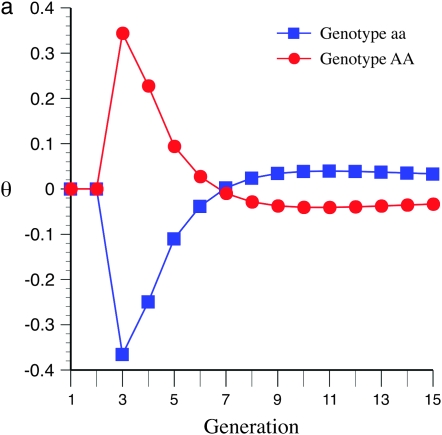
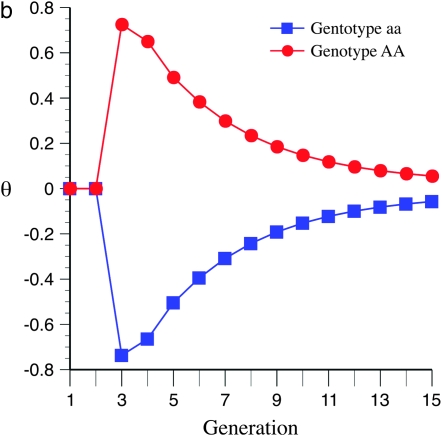
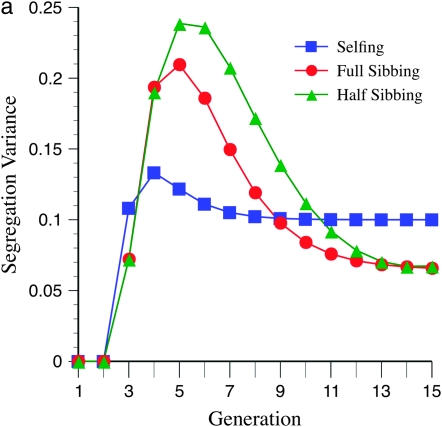
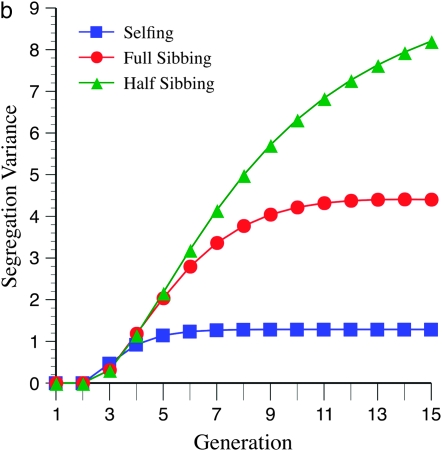
The genetic basis of variation in recombination in higher plants is polygenic and poorly understood, despite its theoretical and practical importance. Here a method of detecting quantitative trait loci (QTL) influencing recombination in recombinant inbred lines (RILs) is proposed that relies upon the fact that genotype data within RILs carry the signature of past recombination. Behavior of the segregational genetic variance in numbers of chromosomal crossovers (recombination) over generations is described for self-, full-sib-, and half-sib-generated RILs with no dominance in true crossovers. This genetic variance, which as a fraction of the total phenotypic variance contributes to the statistical power of the method, was asymptotically greatest with half sibbing, less with sibbing, and least with selfing. The statistical power to detect a recombination QTL declined with diminishing QTL effect, genome target size, and marker density. For reasonably tight marker linkage power was greater with less intense inbreeding for later generations and vice versa for early generations. Generational optima for segregation variance and statistical power were found, whose onset and narrowness varied with marker density and mating design, being more pronounced for looser marker linkage. Application of this method to a maize RIL population derived from inbred lines Mo17 and B73 and developed by selfing suggested two putative QTL (LOD > 2.4) affecting certain chromosomes, and using a canonical transformation another putative QTL was detected. However, permutation tests failed to support their presence (experimentwise alpha = 0.05). Other populations with more statistical power and chosen specifically for recombination QTL segregation would be more effective.


Figures

F<sc>igure</sc> 1.—
Figure 1.—
For Figures 1–6, generation 1 is the F1 generation. The number of recombinant inbred lines (RILs) N generated by full sibbing needed to detect a recombination QTL as a function of allelic (homozygous) effect is shown. Type I and II errors have been set to 0.01 and 0.10, respectively, for Figures 1–6. A recombination QTL acts upon a 2000-cM target with mean map distance among markers (marker density) of 10 cM (e.g., for individuals in which the recombination QTL is heterozygous). (a) Results are shown for 20, 10, 5, and 1% plus or minus the additive homozygote effect upon true numbers of true crossovers formula image relative to QTL heterozygotes. (b) The same as a, except the 1% homozygote effect has been deleted to provide greater detail for the larger allelic effects.
F<sc>igure</sc> 2.—
Figure 2.—
The number of RILs N generated by full sibbing needed to detect a recombination QTL as a function of recombination target sizes of 2000, 1000, 400, 200, and 100 cM, with homozygote allelic effect of 10%, as in Figure 1.
F<sc>igure</sc> 3.—
Figure 3.—
Effect of marker density and mating system upon N required for recombination QTL detection. The QTL acts upon a 2000-cM region with homozygote effect of 10%. (a) Effect of mating system with mean marker density of 15 cM. (b) Effect of mating system with mean marker density of 10 cM. (c) Effect of mating system with mean marker density of 5 cM.
F<sc>igure</sc> 4.—
Figure 4.—
Effect of marker density and mating design upon segregation variance among RILs for number of crossovers, using the Haldane mapping function (no interference). The recombination QTL acts upon a 2000-cM region with homozygote effect of 10%. (a) Effect of mating design with mean marker density of 15 cM. (b) Effect of mating design with mean marker density of 5 cM.
F<sc>igure</sc> 5.—
Figure 5.—
Effect of marker density upon the between-generational changes in observed crossovers and the expected value over all genotypes; e.g., formula image for generation t in QTL homozygotes under half sibbing, using the Haldane mapping function (no interference). The recombination QTL acts upon a 2000-cM region with homozygote effect of 10%. (a) Effect of mating design with mean marker density of 15 cM. (b) Effect of mating design with mean marker density of 5 cM.
F<sc>igure</sc> 6.—
Figure 6.—
Effect of marker density and mating design upon segregation variance among RILs for numbers of crossovers, using the Kosambi mapping function (interference allowed). The recombination QTL acts upon a 2000-cM region with homozygote effect of 10%. (a) Effect of mating design with mean marker density of 15 cM. (b) Effect of mating design with mean marker density of 5 cM.

References

    1. Beavis, W. D., and D. Grant, 1991. A linkage map based on information from four F2 populations of maize (Zea mays L.). Theor. Appl. Genet. 82: 636–644. - PubMed
    1. Brown, H.S., 1961. Differential chiasma frequencies in self-pollinating and cross- pollinating species of the genus Gilia. Aliso 5: 67–81.
    1. Busso, C. F., C. J. Liu, C. T. Hash, J. R. Witcombe, K. M. Devos et al., 1995. Analysis of recombination rate in female and male gametogenesis in pearl millet (Pennisetum glaucum), using RFLP markers. Theor. Appl. Genet. 90: 242–246. - PubMed
    1. Charlesworth, D., B. Charlesworth and C. Strobeck, 1979. Selection for recombination in partially self-fertilizing populations. Genetics 93: 237–244. - PMC - PubMed
    1. Churchill, G. A., and R. W. Doerge, 1994. Empirical threshold values for quantitative trait mapping. Genetics 138: 963–971. - PMC - PubMed