. 2007 Dec;177(4):2151-60.
doi: 10.1534/genetics.107.071126. Epub 2007 Oct 18.

On recombination-induced multiple and simultaneous coalescent events

Affiliations

On recombination-induced multiple and simultaneous coalescent events

Joanna L Davies et al. Genetics. 2007 Dec.

Abstract

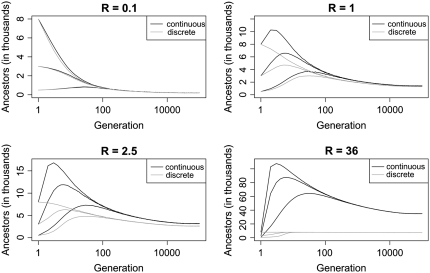
Coalescent theory deals with the dynamics of how sampled genetic material has spread through a population from a single ancestor over many generations and is ubiquitous in contemporary molecular population genetics. Inherent in most applications is a continuous-time approximation that is derived under the assumption that sample size is small relative to the actual population size. In effect, this precludes multiple and simultaneous coalescent events that take place in the history of large samples. If sequences do not recombine, the number of sequences ancestral to a large sample is reduced sufficiently after relatively few generations such that use of the continuous-time approximation is justified. However, in tracing the history of large chromosomal segments, a large recombination rate per generation will consistently maintain a large number of ancestors. This can create a major disparity between discrete-time and continuous-time models and we analyze its importance, illustrated with model parameters typical of the human genome. The presence of gene conversion exacerbates the disparity and could seriously undermine applications of coalescent theory to complete genomes. However, we show that multiple and simultaneous coalescent events influence global quantities, such as total number of ancestors, but have negligible effect on local quantities, such as linkage disequilibrium. Reassuringly, most applications of the coalescent model with recombination (including association mapping) focus on local quantities.


Figures

F<sc>igure</sc> 1.—
Figure 1.—
An illustration of how ancestral material is traced two generations back in time. Material ancestral to the bottom sequence (the sample/offspring) is shaded, while material ancestral to the two parents is shown with hatched lines going in opposite directions. Although the left grandparent carries material ancestral to all of the left parent, it does not carry material ancestral to all of the offspring. Some of this has been passed via the right parent to the right grandparent. Also observe that the amount of material ancestral to the parents at the grandparents is less than twice the sequence length, as material has coalesced in the crosshatched regions of the left grandparent.
F<sc>igure</sc> 2.—
Figure 2.—
The number of sequences carrying ancestral material as a function of generations back in time. Each plot corresponds to a different recombination rate as labeled.
F<sc>igure</sc> 3.—
Figure 3.—
The mean proportion of sequences of the total population that are ancestral to an extant sample (of any size) as a function of recombination rate once the process has reached an equilibrium distribution. The horizontal dashed line is drawn in for reference and shows where this proportion is exactly 1, i.e., where the entire population is ancestral to the sample.
F<sc>igure</sc> 4.—
Figure 4.—
The average number of coalescent events per generation as a function of the number of ancestral sequences. The number of ancestral sequences is specified indirectly by fixing the recombination rate R. The intervals at which data points are plotted along the horizontal axis are obtained as the average number of sequences in the equilibrium distributions. The dashed line is the expected number of events calculated exactly from the continuous process.
F<sc>igure</sc> 5.—
Figure 5.—
The total amount of ancestral material as a function of generations back in time. Each of the plots corresponds to a different rate of recombination (comparable with Figure 2).
F<sc>igure</sc> 6.—
Figure 6.—
(Left) The average number of segments of ancestral material (once in equilibrium) plotted as a function of recombination rate. (Right) The average segment length as a function of recombination rate.
F<sc>igure</sc> 7.—
Figure 7.—
The number of ancestors as a function of generations back in time. Each graph corresponds to fixed rates of recombination (R) and gene conversion (G) as labeled. The additional dashed lines represent the number of ancestors that contain only ancestral material as a result of a gene conversion event. This number is initially zero regardless of the sample size. The larger the sample size is, the higher the peak of the corresponding dashed line.

References

    1. Fu, Y. X., 2006. Exact coalescence for the Wright-Fisher model. Theor. Popul. Biol. 69: 385–394. - PubMed
    1. Griffiths, R. C., and P. Marjoram, 1996. Ancestral inference from samples of DNA sequences with recombination. J. Comput. Biol. 3(4): 479–502. - PubMed
    1. Hein, J., M. H. Schierup and C. Wiuf, 2005. Gene Genealogies Variation and Evolution. Oxford University Press, London/New York/Oxford.
    1. Hudson, R., 1983. Properties of the neutral allele model with intragenic recombination. Theor. Popul. Biol. 23: 183–201. - PubMed
    1. Kingman, J. F. C., 1982. The coalescent. Stoch. Proc. Appl. 13: 235–248.