

A mixed-model quantitative trait loci (QTL) analysis for multiple-environment trial data using environmental covariables for QTL-by-environment interactions, with an example in maize
- PMID: 17947443
- PMCID: PMC2147942
- DOI: 10.1534/genetics.107.071068
A mixed-model quantitative trait loci (QTL) analysis for multiple-environment trial data using environmental covariables for QTL-by-environment interactions, with an example in maize
Abstract
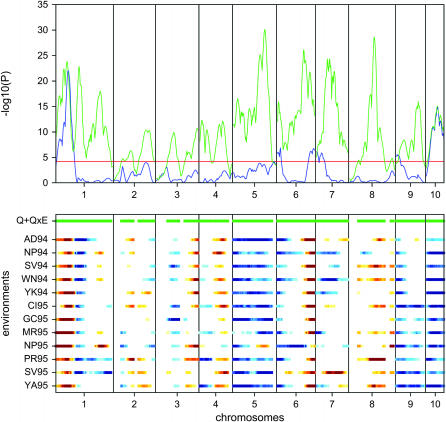
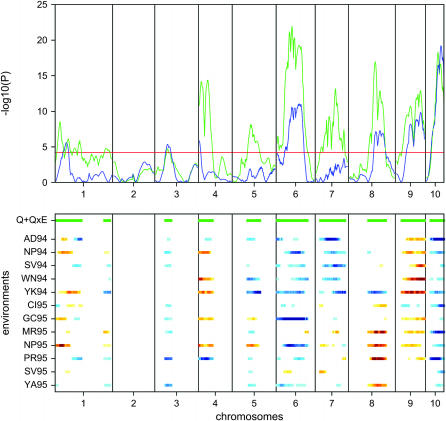
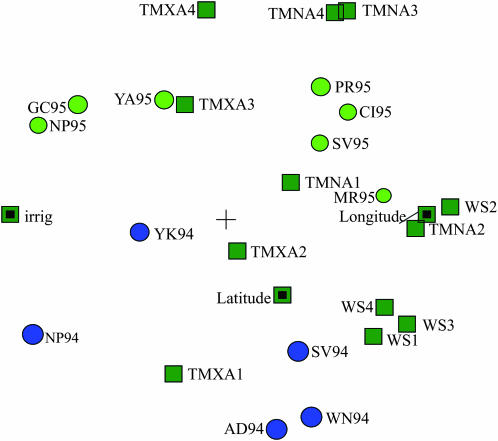
Complex quantitative traits of plants as measured on collections of genotypes across multiple environments are the outcome of processes that depend in intricate ways on genotype and environment simultaneously. For a better understanding of the genetic architecture of such traits as observed across environments, genotype-by-environment interaction should be modeled with statistical models that use explicit information on genotypes and environments. The modeling approach we propose explains genotype-by-environment interaction by differential quantitative trait locus (QTL) expression in relation to environmental variables. We analyzed grain yield and grain moisture for an experimental data set composed of 976 F(5) maize testcross progenies evaluated across 12 environments in the U.S. corn belt during 1994 and 1995. The strategy we used was based on mixed models and started with a phenotypic analysis of multi-environment data, modeling genotype-by-environment interactions and associated genetic correlations between environments, while taking into account intraenvironmental error structures. The phenotypic mixed models were then extended to QTL models via the incorporation of marker information as genotypic covariables. A majority of the detected QTL showed significant QTL-by-environment interactions (QEI). The QEI were further analyzed by including environmental covariates into the mixed model. Most QEI could be understood as differential QTL expression conditional on longitude or year, both consequences of temperature differences during critical stages of the growth.
Figures
Similar articles
-
Mapping QTLs and QTL x environment interaction for CIMMYT maize drought stress program using factorial regression and partial least squares methods.Theor Appl Genet. 2006 Apr;112(6):1009-23. doi: 10.1007/s00122-005-0204-z. Epub 2006 Mar 15. Theor Appl Genet. 2006. PMID: 16538513
-
Correlations and comparisons of quantitative trait loci with family per se and testcross performance for grain yield and related traits in maize.Theor Appl Genet. 2013 Mar;126(3):773-89. doi: 10.1007/s00122-012-2017-1. Epub 2012 Nov 27. Theor Appl Genet. 2013. PMID: 23183923
-
Use of trial clustering to study QTL x environment effects for grain yield and related traits in maize.Theor Appl Genet. 2004 Dec;110(1):92-105. doi: 10.1007/s00122-004-1781-y. Epub 2004 Nov 12. Theor Appl Genet. 2004. PMID: 15551040
-
Detection and use of QTL for complex traits in multiple environments.Curr Opin Plant Biol. 2010 Apr;13(2):193-205. doi: 10.1016/j.pbi.2010.01.001. Curr Opin Plant Biol. 2010. PMID: 20137999 Review.
-
'Particle genetics': treating every cell as unique.Trends Genet. 2014 Feb;30(2):49-56. doi: 10.1016/j.tig.2013.11.002. Epub 2013 Dec 6. Trends Genet. 2014. PMID: 24315431 Free PMC article. Review.
Cited by
-
QTL mapping of growth-related traits in a full-sib family of rubber tree (Hevea brasiliensis) evaluated in a sub-tropical climate.PLoS One. 2013 Apr 19;8(4):e61238. doi: 10.1371/journal.pone.0061238. Print 2013. PLoS One. 2013. PMID: 23620732 Free PMC article.
-
Generalized linear mixed models for mapping multiple quantitative trait loci.Heredity (Edinb). 2012 Jul;109(1):41-9. doi: 10.1038/hdy.2012.10. Epub 2012 Mar 14. Heredity (Edinb). 2012. PMID: 22415425 Free PMC article.
-
Multi-trait QTL analysis for agronomic and quality characters of Agaricus bisporus (button mushrooms).AMB Express. 2016 Dec;6(1):67. doi: 10.1186/s13568-016-0239-3. Epub 2016 Sep 8. AMB Express. 2016. PMID: 27620731 Free PMC article.
-
Needles: Toward Large-Scale Genomic Prediction with Marker-by-Environment Interaction.Genetics. 2016 May;203(1):543-55. doi: 10.1534/genetics.115.179887. Epub 2016 Mar 2. Genetics. 2016. PMID: 26936924 Free PMC article.
-
Genetic Linkage and Physical Mapping for an Oyster Mushroom (Pleurotus cornucopiae) and Quantitative Trait Locus Analysis for Cap Color.Appl Environ Microbiol. 2021 Oct 14;87(21):e0095321. doi: 10.1128/AEM.00953-21. Epub 2021 Aug 18. Appl Environ Microbiol. 2021. PMID: 34406836 Free PMC article.
References
-
- Benjamini, Y., and Y. Hochberg, 1995. Controlling the false discovery rate: a practical and powerful approach to multiple testing. J. R. Stat. Soc. Ser. B 57(1): 289–300.
-
- Broman, K. W., H. Wu, Ś. Sen and G. A. Churchill, 2003. R/qtl: QTL mapping in experimental crosses. Bioinformatics 19: 889–890. - PubMed
-
- Campbell, B. T., P. S. Baenziger, K. M. Eskridge, H. Budak, N. A. Streck et al., 2004. Using environmental covariates to explain genotype × environment and QTL × environment interactions for agronomic traits on chromosome 3A of wheat. Genomics Mol. Genet. Biotechnol. 44: 620–627.
MeSH terms
LinkOut - more resources
Full Text Sources
Other Literature Sources
Miscellaneous
