. 2007;2(10):2366-82.
doi: 10.1038/nprot.2007.324.

Integration of biological networks and gene expression data using Cytoscape

Affiliations

Integration of biological networks and gene expression data using Cytoscape

Melissa S Cline et al. Nat Protoc. 2007.

Abstract

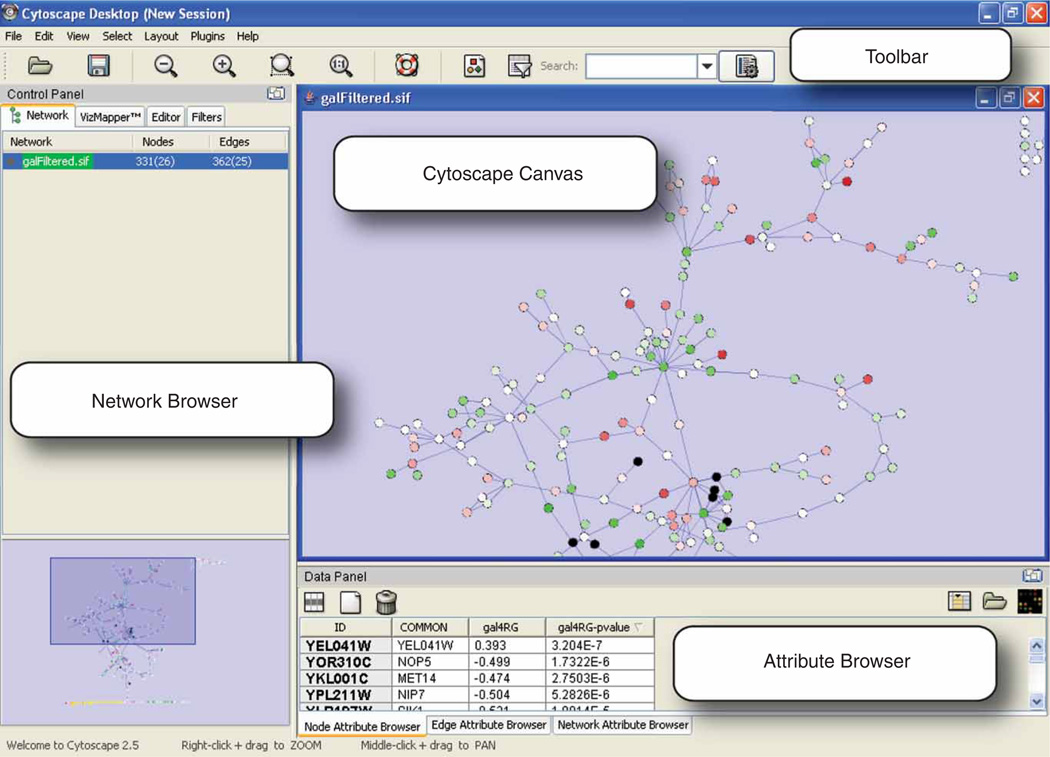
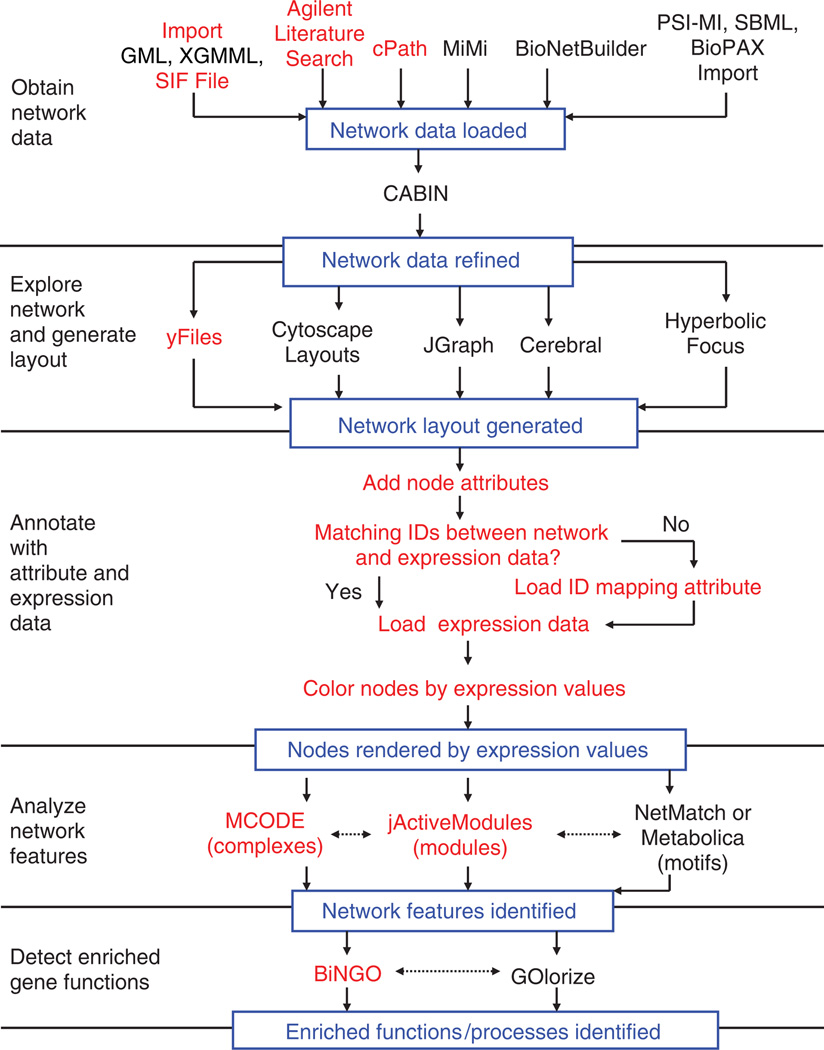
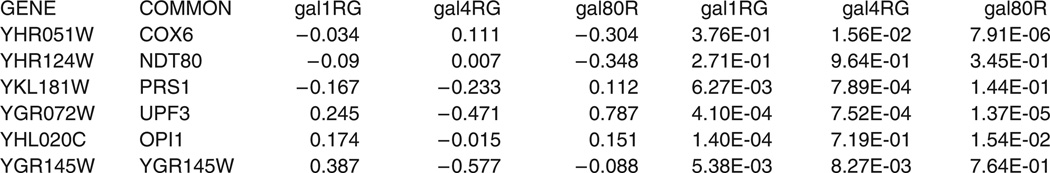
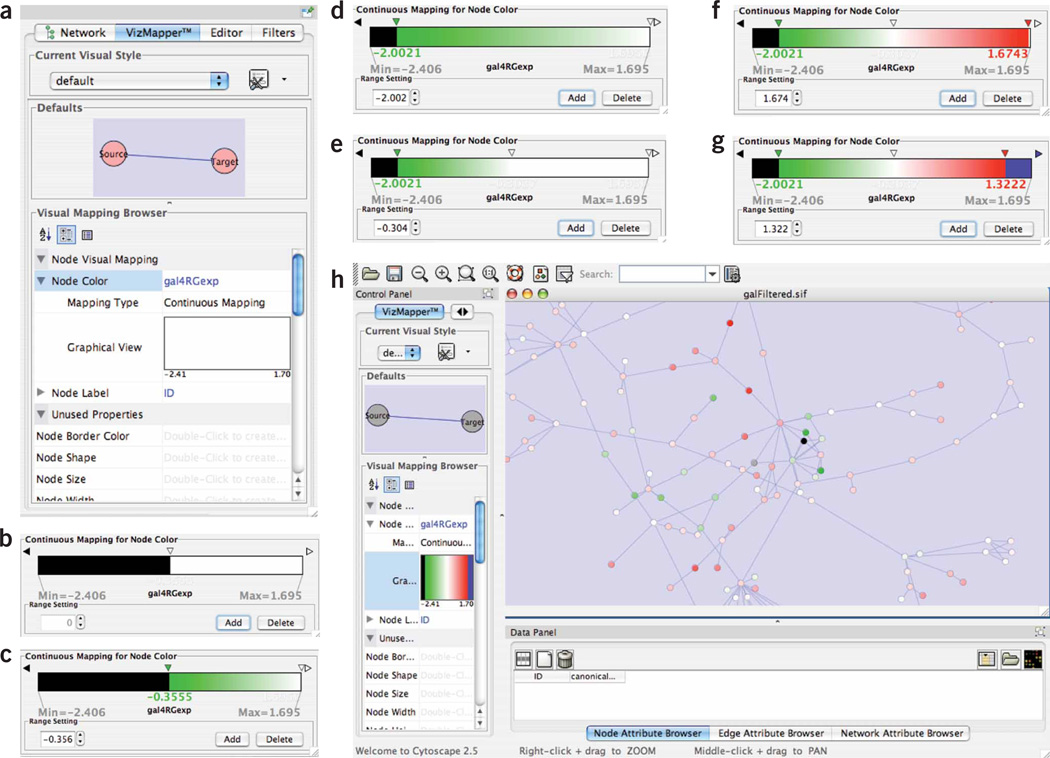
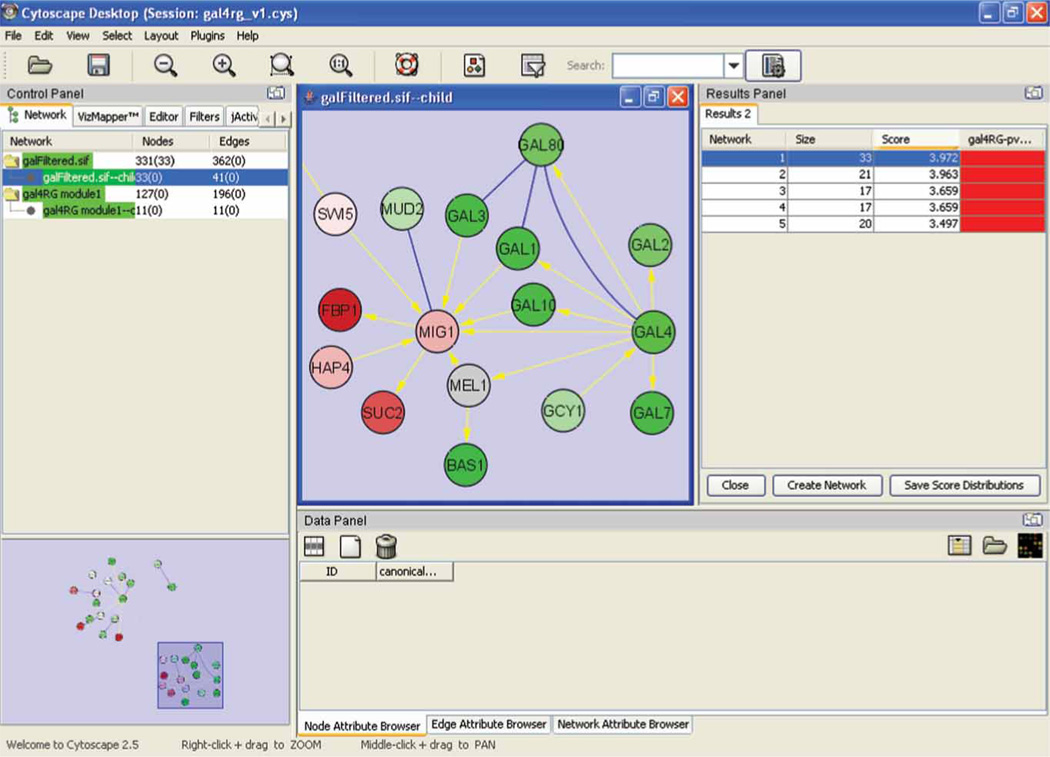
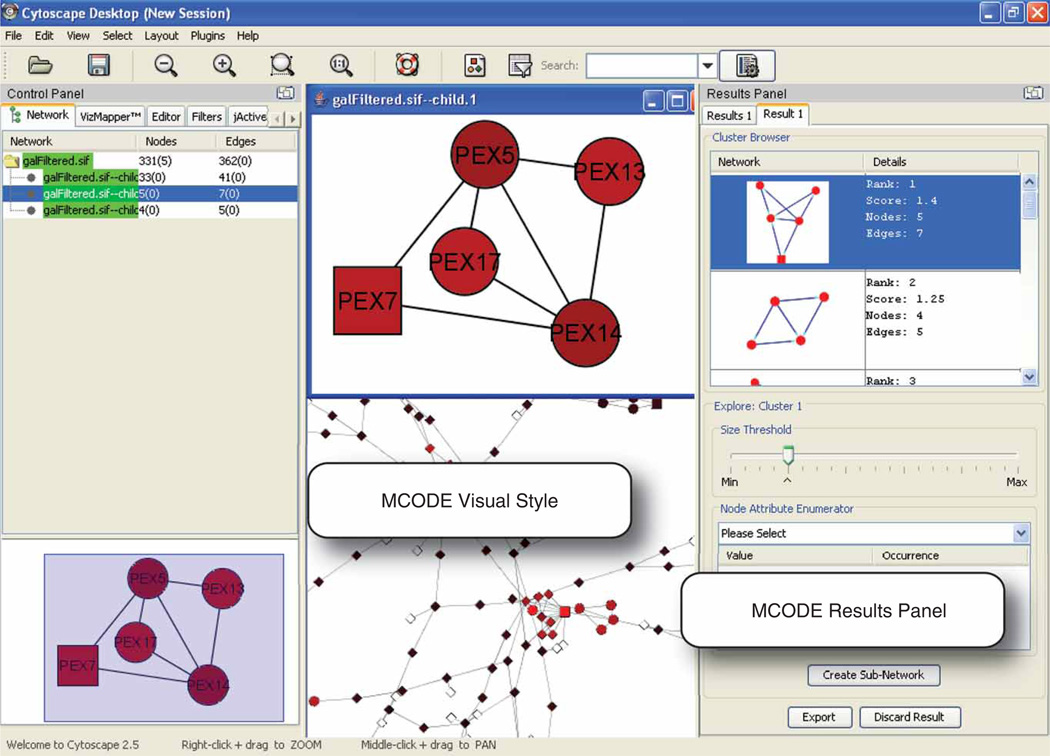
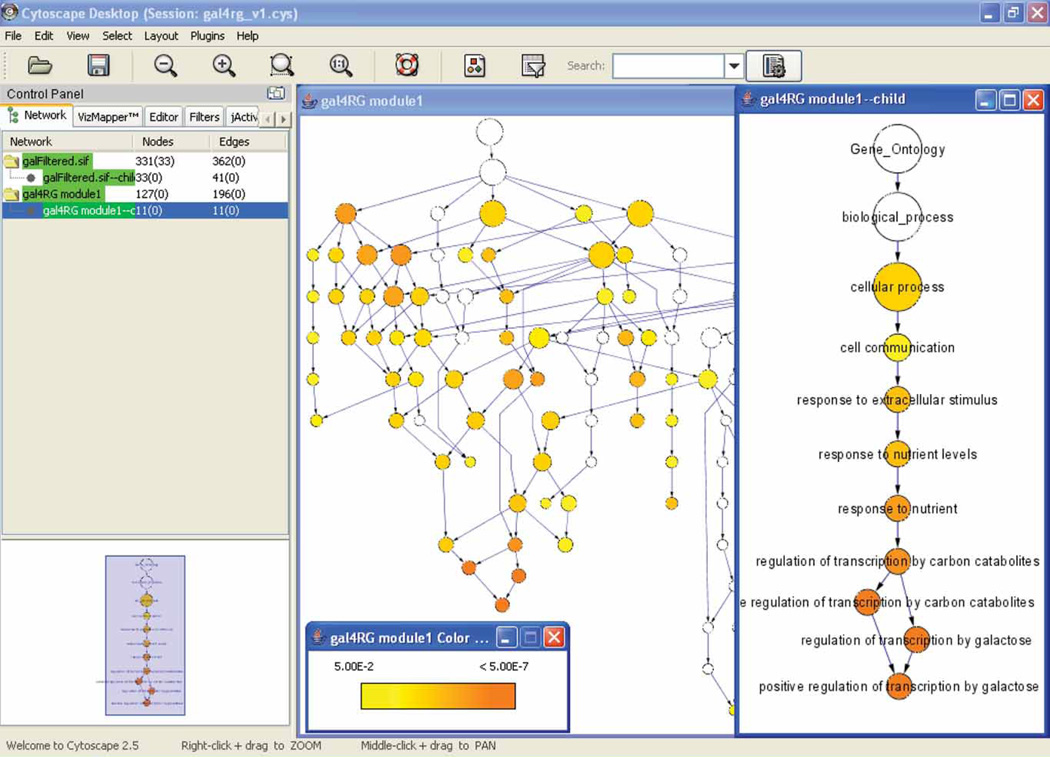
Cytoscape is a free software package for visualizing, modeling and analyzing molecular and genetic interaction networks. This protocol explains how to use Cytoscape to analyze the results of mRNA expression profiling, and other functional genomics and proteomics experiments, in the context of an interaction network obtained for genes of interest. Five major steps are described: (i) obtaining a gene or protein network, (ii) displaying the network using layout algorithms, (iii) integrating with gene expression and other functional attributes, (iv) identifying putative complexes and functional modules and (v) identifying enriched Gene Ontology annotations in the network. These steps provide a broad sample of the types of analyses performed by Cytoscape.


Figures

Figure 1
Figure 1
The Cytoscape Desktop. The Cytoscape canvas displays network data. The toolbar (top) contains the command buttons. The name of each command button is shown when the mouse pointer hovers over it. The Control Panel (left) displays the Network tree viewer, which lists the available networks by name and size. The Network Overview Pane (lower left) shows the current network in white and the displayed portion in blue. Finally, the Data Panel (lower right) can be used to display node, edge and network attribute data. The Cytoscape Desktop shows the sample network and expression data, with nodes colored by expression values from lowest (green) to highest (red).
Figure 2
Figure 2
Outline of the protocol. The steps in red are included in this protocol, while analyses listed in black represent useful alternatives that achieve related goals. Dotted lines represent steps that can be done in any order, while solid lines represent steps that must be done in sequence. Expression data are not required for finding putative complexes (with MCODE) or for network motifs (with NetMatch or Metabolica), but can aid in interpreting the results by suggesting system dynamics.
Figure 3
Figure 3
Sample expression input file, showing genes and associated columns of expression data for multiple experiments.
Figure 4
Figure 4
The steps in creating a green-to-red node color gradient. (a) Specify a new attribute-based gradient; (b) add two range selector end points; (c) change the color at the lower end point to green; (d) move this end point to the bottom of the range; (e) add another new range selector end point; (f) change the color at the top of the range to red; (g) change the color at the top of the range to blue; and (h) a network with the nodes rendered with a red–green color map.
Figure 5
Figure 5
JActiveModules output with the top-scoring module selected and displayed as a separate child network. Here, jActiveModules has analyzed the gal4RG expression condition to identify a module of predominantly downregulated genes (green) involved in galactose metabolism. Blue links: protein– protein interactions; yellow links: protein–DNA interactions.
Figure 6
Figure 6
MCODE output, showing a densely connected network region that is a putative complex. This complex contains five PEX proteins involved in the function of the yeast peroxisome.
Figure 7
Figure 7
BiNGO output, analyzing the active module shown in Figure 5. This analysis shows significant enrichment for processes relating to metabolism and galactose.

References

    1. Kislinger T, et al. Global survey of organ and organelle protein expression in mouse: combined proteomic and transcriptomic profiling. Cell. 2006;125:173–186. - PubMed
    1. Galbraith DW, Birnbaum K. Global studies of cell type-specific gene expression in plants. Annu. Rev. Plant Biol. 2006;57:451–475. - PubMed
    1. Butcher EC, Berg EL, Kunkel EJ. Systems biology in drug discovery. Nat. Biotechnol. 2004;22:1253–1259. - PubMed
    1. Bader GD, et al. Functional genomics and proteomics: charting a multidimensional map of the yeast cell. Trends Cell Biol. 2003;13:344–356. - PubMed
    1. Subramanian A, et al. Gene set enrichment analysis: a knowledge-based approach for interpreting genome-wide expression profiles. Proc. Natl. Acad. Sci. USA. 2005;102:15545–15550. - PMC - PubMed

Publication types