. 2007;2(10):2608-23.
doi: 10.1038/nprot.2007.380.

DMS footprinting of structured RNAs and RNA-protein complexes

Affiliations

DMS footprinting of structured RNAs and RNA-protein complexes

Pilar Tijerina et al. Nat Protoc. 2007.

Abstract

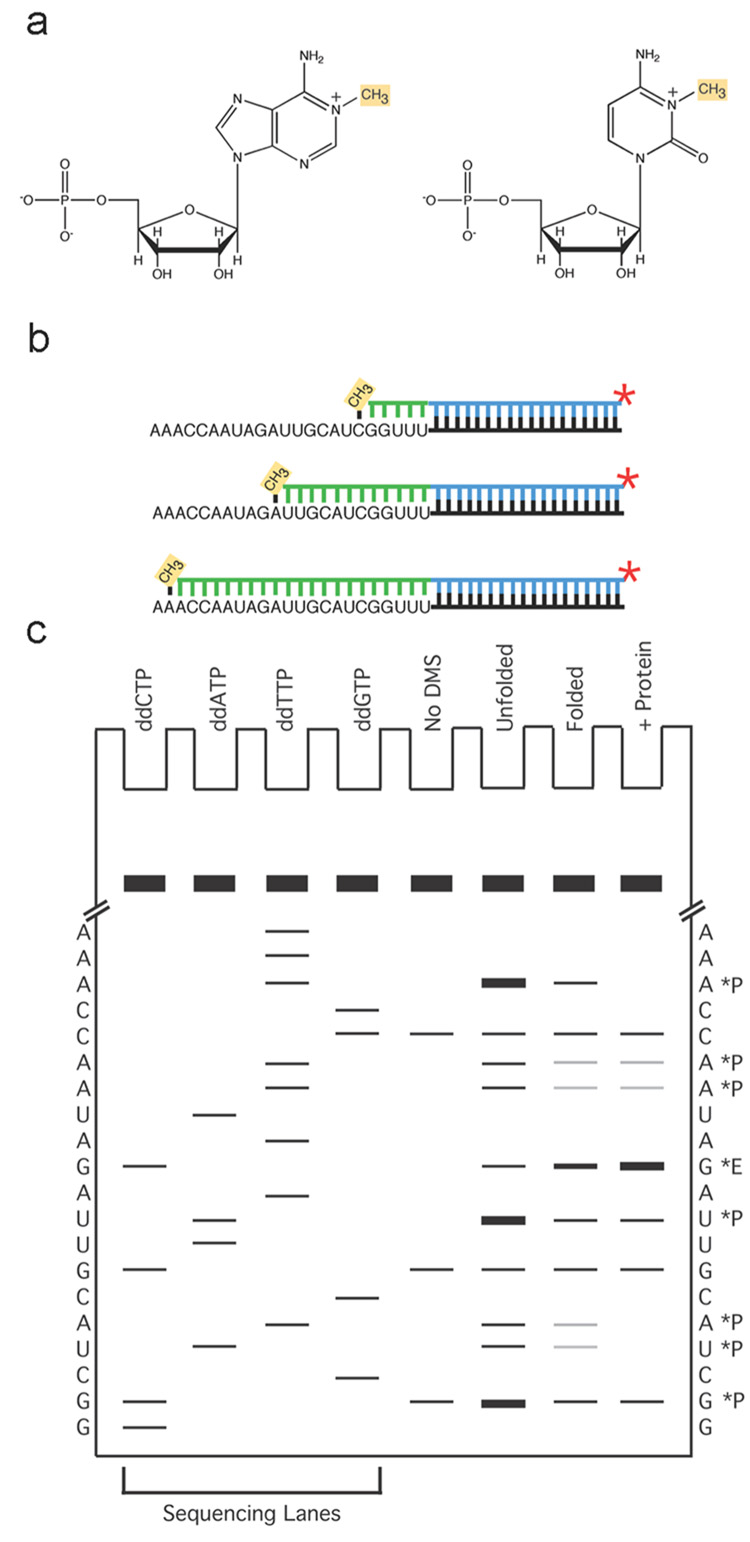
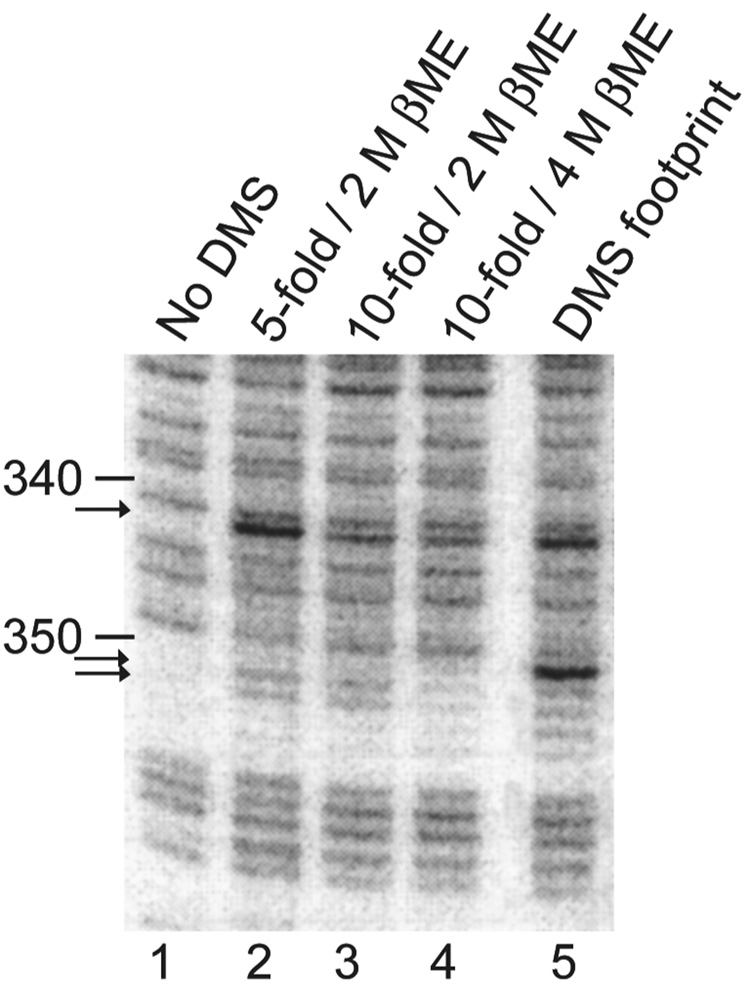
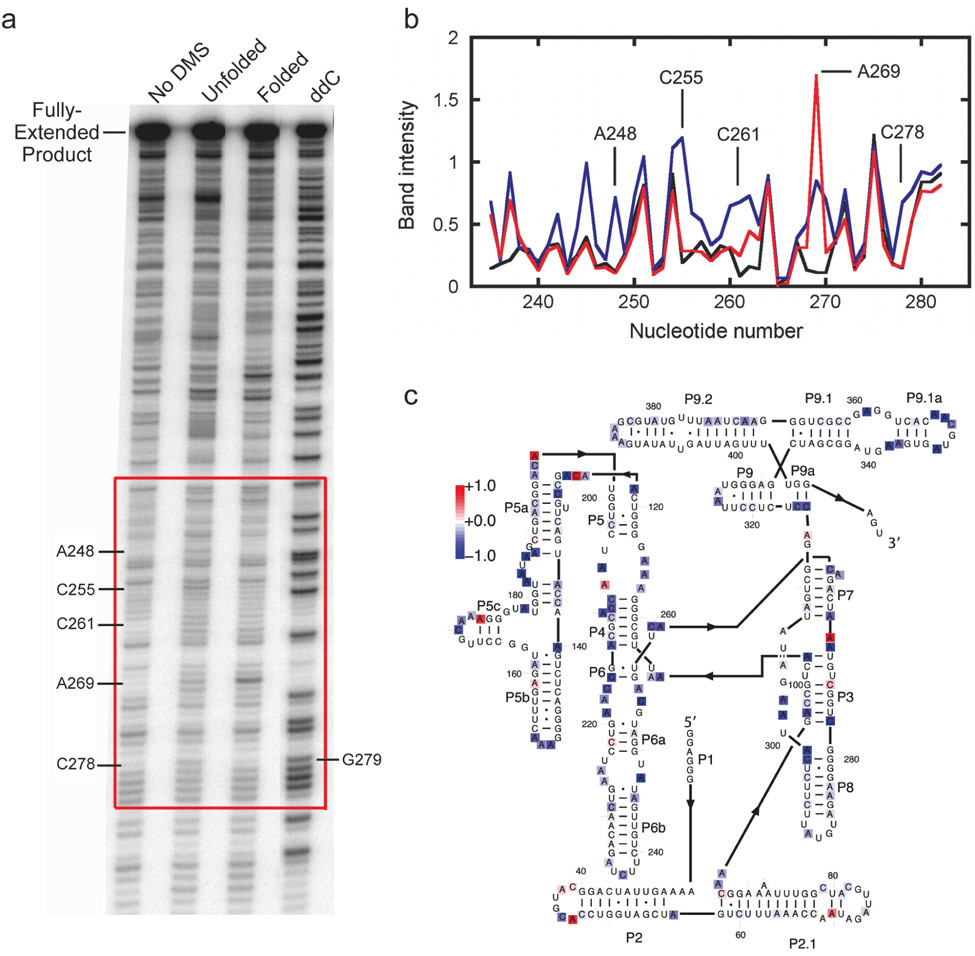
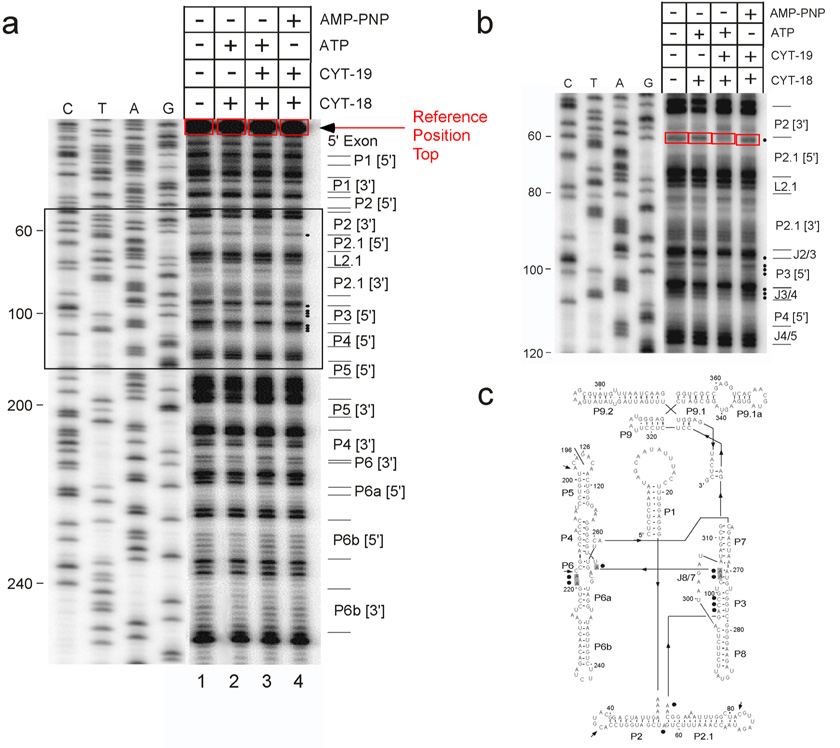
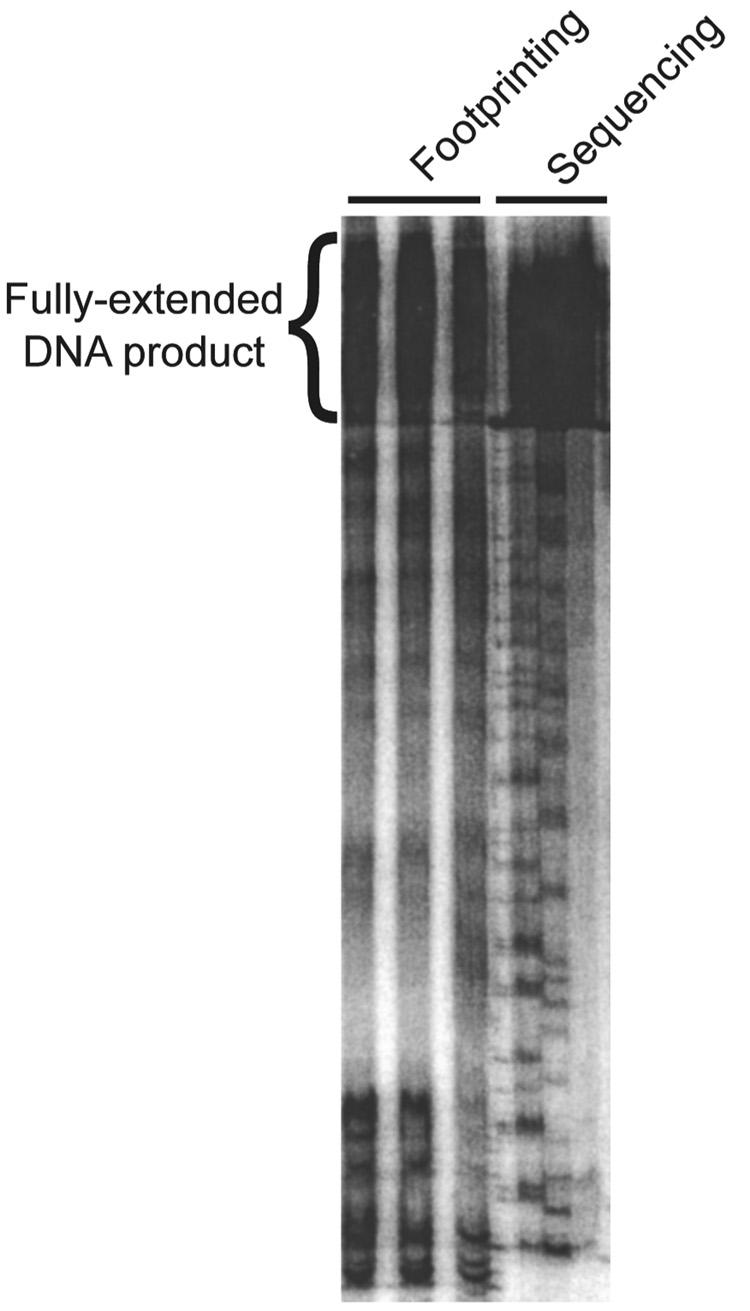
We describe a protocol in which dimethyl sulfate (DMS) modification of the base-pairing faces of unpaired adenosine and cytidine nucleotides is used for structural analysis of RNAs and RNA-protein complexes (RNPs). The protocol is optimized for RNAs of small to moderate size (< or = 500 nt). The RNA or RNP is first exposed to DMS under conditions that promote formation of the folded structure or complex, as well as 'control' conditions that do not allow folding or complex formation. The positions and extents of modification are then determined by primer extension, polyacrylamide gel electrophoresis and quantitative analysis. From changes in the extent of modification upon folding or protein binding (appearance of a 'footprint'), it is possible to detect local changes in the secondary and tertiary structure of RNA, as well as the formation of RNA-protein contacts. This protocol takes 1.5-3 d to complete, depending on the type of analysis used.


Figures

Figure 1
Figure 1. General schematic diagram of DMS footprinting
a, The modifications detected by this method are methylation at N1 of adenine and N3 of cytosine, as indicated in yellow. b, Primer extension. The DMS modification reaction is carried out under limiting conditions so that each molecule has no more than an average of one detectable modification. Reverse transcription is illustrated (product in green) proceeding from a radiolabeled primer (blue line) until it is blocked at a position one nucleotide upstream from a methylated A or C nucleotide. This reaction on a population of modified RNAs generates a family of radiolabeled products whose lengths are determined by the positions of modifications, and the proportions of these different products reflect the extents of modification at each position. c, PAGE analysis of reverse transcription products. Sequencing lanes at the left are used to determine the position of modification for each experimental band. To the left and right of the gel is shown the sequence of the RNA, as determined from the sequencing reactions. The four lanes at the right show expected results from the experimental lanes. The lane illustrating a reaction that was not treated with DMS (the ‘No DMS’ lane) displays several bands, which is a typical result. These are DMS-independent positions of reverse transcriptase stopping or pausing. In contrast, the bands that are enriched in the DMS treated samples (‘Unfolded’, ‘Folded’, and ‘+ protein’) reflect DMS modification. Note that these bands are one position lower on the gel than A and C nucleotides as determined in the sequencing lanes. This is because reverse transcriptase is blocked one position upstream from the modified position. Nucleotides that give changes in extent of modification upon folding or protein binding are indicated with asterisks and ‘P’ for protection or ‘E’ for enhancement.
Figure 2
Figure 2. Establishment of a solution quench of DMS modification reaction
Samples in lanes 2–4 were diluted as indicated, from 50 µl, into a solution containing β-mercaptoethanol at the indicated concentrations (200 µl or 450 µl). DMS was then added (1 µl of DMS diluted 1:3 with EtOH) and samples were incubated at room temperature for 5 min before precipitating with EtOH. Lane 1 was treated identically to lane 3 except that DMS was not added, and lane 5 was treated identically to lane 3 except that DMS (1 µl, diluted 1:3 with EtOH) was added first. The sample (50 µl) was incubated at room temperature for 1 min with DMS, followed by addition of quench solution. Arrows indicate nucleotides that are modified detectably in lanes 2 and 3, indicating that these quench solutions were not sufficient to protect the RNA from modification. Lane 4 shows nearly perfect quenching (although modification at position 342 is still visible), with final concentrations of 3.6 M β-mercaptoethanol and 0.067% DMS. The quench conditions that we describe in the Procedure are 3.8 M β-mercaptoethanol and 0.033% (3.5 mM) DMS, which gave no detectable modification in an equivalent experiment (not shown).
Figure 3
Figure 3. Quantitative analysis of DMS footprinting to monitor RNA folding
This experiment monitors Mg2+ dependent folding of the Tetrahymena group I ribozyme. a, DMS footprinting gel. The DMS exposure time for this experiment was relatively short, 1 min at 25 °C with 0.67% DMS, such that the background from RNase degradation and/or pauses by RT is significant relative to the DMS-dependent signal (bands in lane marked ‘No DMS’). However, DMS-dependent bands are readily observed, as indicated by nucleotide labels. The label at the right, G279, is included to illustrate that fragments indicating DMS modification migrate more rapidly by one nucleotide than the corresponding fragments in the sequencing lanes. b, Analysis using SAFA of the region of panel a indicated by the red square. Band intensity was determined by dividing the integrated intensity of each band by the corresponding intensity for the fully-extended primer (determined by boxing this band using Image Quant), and multiplying this by 1000. Thus, an intensity value of 1 means that the indicated band was 0.1% as intense as the fully-extended product, or for the DMS-dependent bands, that roughly 0.1% of the RNA was methylated at this position. c, Comparison of the DMS protection patterns for the folded and unfolded RNAs. Values were obtained by subtracting the intensity values in the unfolded form from those representing the folded form, so that a negative value (colored blue as indicated by the scale bar) represents a nucleotide that is protected in the folded RNA relative to the unfolded RNA, whereas a nucleotide colored red represents a nucleotide that displays enhanced reactivity in the folded RNA.
Figure 4
Figure 4. DMS footprinting of an RNA-protein complex and quantitative analysis using manual boxing
This experiment monitored formation of a complex between a variant of the Tetrahymena LSU intron (ΔP5abc) and the specific-binding protein CYT-18, and the effect of the DEAD-box chaperone protein CYT-19 on this complex. a, Footprinting gel. 20 nM RNA was pre-incubated with 100 nM CYT-18 alone or also with 100 nM CYT-19 plus 1 mM ATP or AMP-PNP as indicated above each lane, and then modified with 0.2% DMS. Modifications were mapped by primer extension with MMLV RT, using a 5′-labeled primer complementary to intron positions 274–298. Results were analyzed by manual boxing. The band at the top of the gel, representing fully extended product, is quantitated as a reference. Bands to be analyzed (labeled with black dots) differ in intensity between the four experimental lanes. They are boxed and quantitated and the counts are expressed as a percentage of the reference counts in Table 2. Lanes C, T, A and G are dideoxy sequencing ladders of the plasmid DNA using the same 5′-labeled primer. b, Enlargement of the boxed region, which contains the area of interest. Intron positions are indicated to the left, and group I intron regions are indicated to the right. Boxes are shown for one of the analyzed nucleotides (A57). c, Secondary structure showing nucleotides whose modification level was dependent on the added proteins, as indicated by the this and other experiments (not shown). Shading indicates nucleotides that were protected upon CYT-18 addition (differences of at least 0.01, see Table 2 for quantiation of A103-A105), and closed circles indicate nucleotides that were protected upon addition of CYT-19 and ATP. Arrows indicate nucleotides that were enhanced for reactivity by addition of CYT-19 and ATP. All of the nucleotides that were protected upon CYT-18 addition were protected further upon addition of CYT-19 (Table 2), presumably because CYT-18 does not bind stably to the misfolded ribozyme that accumulates in the absence of CYT-19 (A. Chadee and R. Russell, unpublished results). All of the highlighted nucleotides gave bands in reactions with DMS that were substantially more intense than the corresponding reactions without DMS (not shown).
Figure 5
Figure 5
DMS footprinting gel from an experiment in which the RNA degradation steps were omitted (steps 25–26). See Table 1, Smeary gel.

References

    1. Golden BL. Preparation and crystallization of RNA. Methods Mol. Biol. 363;2007:239–257. - PubMed
    1. Wu H, Finger LD, Feigon J. Structure determination of protein/RNA complexes by NMR. Methods Enzymol. 2005;394:525–545. - PubMed
    1. Myong S, Stevens BC, Ha T. Bridging conformational dynamics and function using single-molecule spectroscopy. Structure. 2006;14:633–643. - PubMed
    1. Lipfert J, Doniach S. Small-angle X-ray scattering from RNA, proteins, and protein complexes. Annu. Rev. Biophys. Biomol. Struct. 2007;36:307–327. - PubMed
    1. Kim NK, Murali A, DeRose VJ. A distance ruler for RNA using EPR and site-directed spin labeling. Chem. Biol. 2004;11:939–948. - PubMed

Publication types

MeSH terms