. 2007 Nov 14;26(22):4694-708.
doi: 10.1038/sj.emboj.7601895. Epub 2007 Oct 18.

The structure of FtsZ filaments in vivo suggests a force-generating role in cell division

Affiliations

The structure of FtsZ filaments in vivo suggests a force-generating role in cell division

Zhuo Li et al. EMBO J. .

Abstract

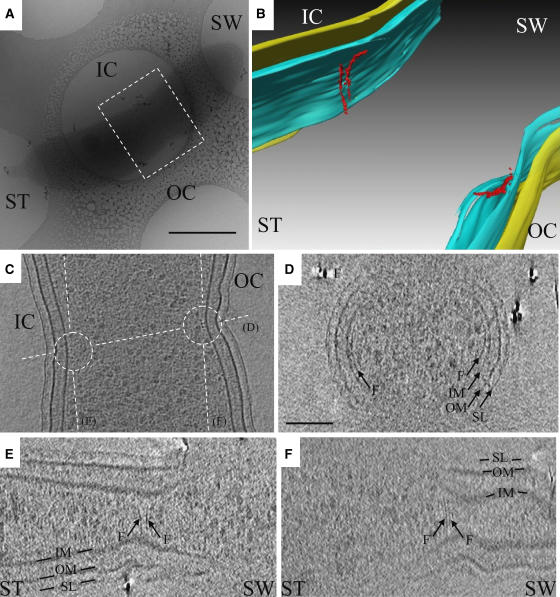
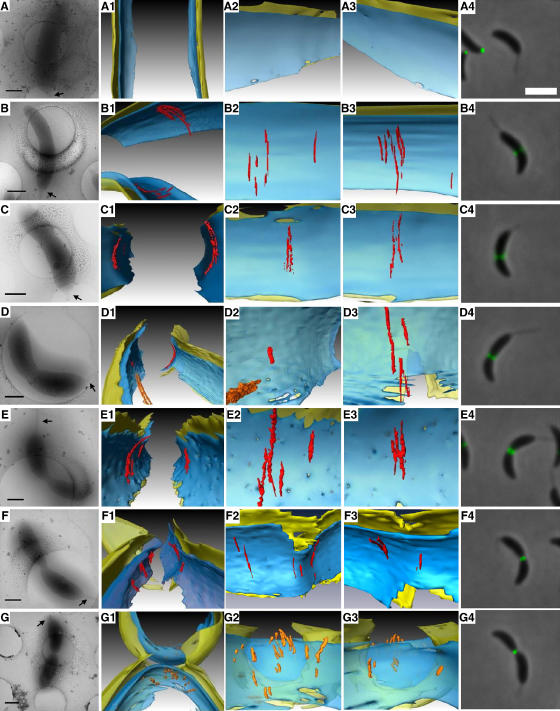
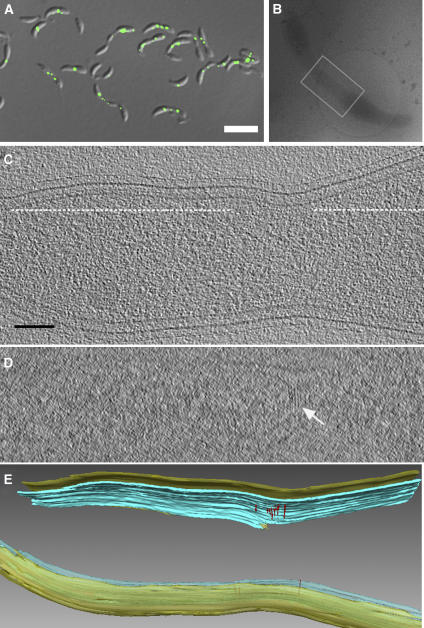
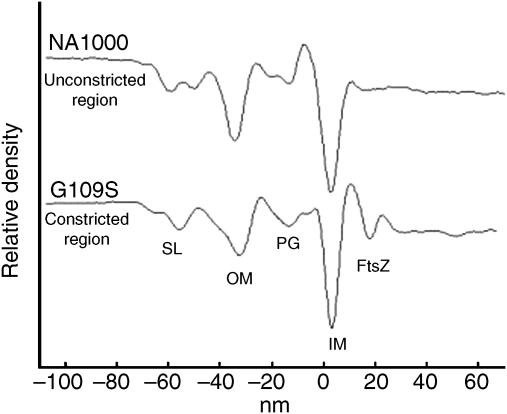
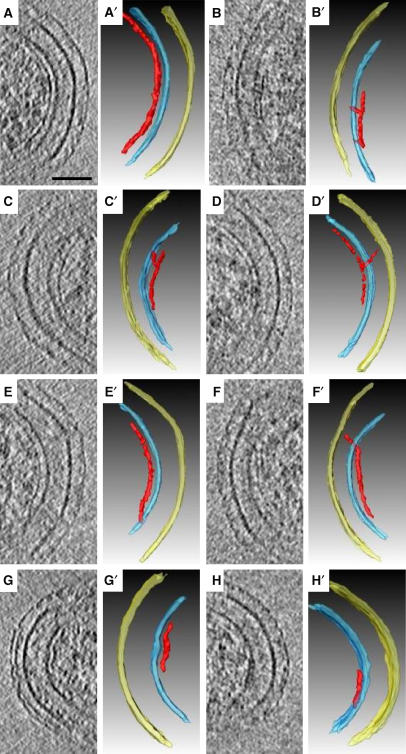
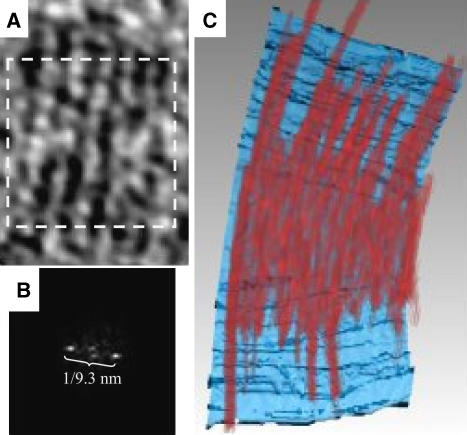
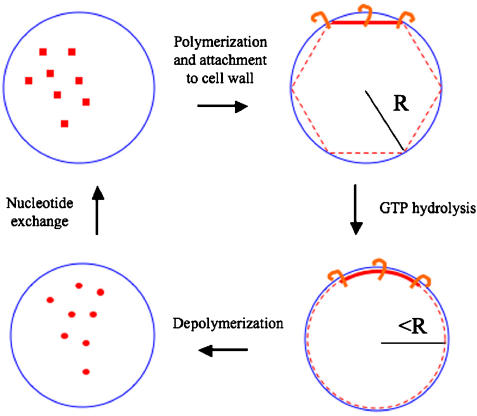
In prokaryotes, FtsZ (the filamentous temperature sensitive protein Z) is a nearly ubiquitous GTPase that localizes in a ring at the leading edge of constricting plasma membranes during cell division. Here we report electron cryotomographic reconstructions of dividing Caulobacter crescentus cells wherein individual arc-like filaments were resolved just underneath the inner membrane at constriction sites. The filaments' position, orientation, time of appearance, and resistance to A22 all suggested that they were FtsZ. Predictable changes in the number, length, and distribution of filaments in cells where the expression levels and stability of FtsZ were altered supported that conclusion. In contrast to the thick, closed-ring-like structure suggested by fluorescence light microscopy, throughout the constriction process the Z-ring was seen here to consist of just a few short (approximately 100 nm) filaments spaced erratically near the division site. Additional densities connecting filaments to the cell wall, occasional straight segments, and abrupt kinks were also seen. An 'iterative pinching' model is proposed wherein FtsZ itself generates the force that constricts the membrane in a GTP-hydrolysis-driven cycle of polymerization, membrane attachment, conformational change, depolymerization, and nucleotide exchange.


Figures

Figure 1
Figure 1
Arc-like filaments at the division site in C. crescentus NA1000. (A) Low magnification cryo-EM view of a C. crescentus NA1000 cell plunge-frozen on an EM grid after acquisition of the tilt-series. The darker gray elongated object is the cell, suspended in vitreous ice across a circular hole in the carbon support film. The dashed box shows the region segmented in (B). ST: stalked pole; SW: pole opposite the stalked pole; IC: inner curvature; OC: outer curvature. Scale bar 500 nm. (B) 3-D segmentation of the inner membrane (blue), outer membrane (yellow), and arc-like filaments (red) in the reconstruction from the same cell. Because the image contains 3-D perspective effects, no scale bar is included. (C) 8 nm slice through the reconstruction parallel to the grid, showing the filaments in cross-section (small dark dots near the center of the circles) next to the membrane as well as the orientations of the other slices shown in panels (D–F) (dashed lines). (DF) 5.4 nm slices through the reconstruction, showing that while filaments and other small proteins all appeared as small dots in cross-section, filaments were recognized by their continuous, elongated shape in ‘side' views such as these. Unfortunately, space does not allow all relevant slices to be shown. Thus here and in other figures, the locations and extents of all visible filaments were manually traced and presented as colorized, segmented models (like panel B), which are necessarily interpretations but do allow 3-D structures to be shown in 2-D figures. The colors and labels are consistent within all the figures: IM: inner membrane; OM: outer membrane; SL: surface layer; F: arc-like (FtsZ) filaments. The scale bar in (D) is 100 nm and serves for panels (C-F).
Figure 2
Figure 2
Filament dynamics during cell division. Each row represents a different stage of cell division, arranged in approximate sequence from an unconstricted stalked state (A) until after fission of the inner membrane has formed two separate cytoplasmic compartments (G). Within each row, the first four columns show different depictions of a single cell reconstructed by ECT and the last column shows an fLM image of a different cell taken at an apparently analogous stage. (AG) Low magnification cryo-EM images. Stalked poles are shown with arrows. Scale bars 500 nm. (A1–G1) 3-D segmentations of the division sites. (A2–G2) ‘Face-on' views from the cytoplasm of the ‘left' side of the cell wall. (A3–G3) ‘Face-on' views of the ‘right' side of the cell wall, again from the cytoplasm. (A4–G4) fLM images of NA1000 cells expressing FtsZ-YFP. Scale bar 2 μm. In D1–D2, an additional cytoplasmic filament bundle (Briegel et al, 2006) was surface-rendered in orange. In G1–G3, no arc-like filaments are observed; instead, the most filamentous densities are surface-rendered in orange for comparison. Note that the cells shown in rows C and E are the same as those shown in Figures 1 and 5AB, respectively, and that supporting unsegmented tomographic slices are shown in Supplementary Figures S1–S6.
Figure 3
Figure 3
Increase in the abundance of arc-like filaments in cells overexpressing FtsZ. (A) Differential interference contrast (DIC) and fLM overlay image of cells overexpressing (wild-type) FtsZ, showing that FtsZ-YFP accumulates in the most constricted points. Scale bar 4 μm. (B) Low magnification cryo-EM view of a similar cell plunge-frozen in vitreous ice across an EM grid after acquisition of the tilt-series. The gray box shows the region segmented in panel (E). For scale, the circular hole in the carbon support film on the EM grid has a diameter of 2 μm. (C) 8 nm slice through the tomogram parallel to the grid. Scale bar 100 nm (for panels C and D). (D) 5 nm slice through the tomogram along the dash line in (C). The white arrow points to the arc-like filaments. (E) 3-D segmentation.
Figure 4
Figure 4
Dramatic increase in the abundance and length of filaments in a mutant overexpressing FtsZG109S. (A) fLM image of cells overexpressing FtsZG109S, showing that FtsZ-YFP accumulates in the extended, constricted division sites. Scale bar 4 μm. (B) Low magnification cryo-EM image of a cell overexpressing FtsZG109S. Scale bar 500 nm. (C) 8 nm slice through the 3-D reconstruction parallel to the grid, showing tens of filaments in cross-section as small black dots close to the membrane. The dashed lines show the position of the slice shown in panel (D). Scale bar 100 nm (for panels C and D). (D) 5.4 nm ‘glancing' slice through the 3-D reconstruction showing tens of filaments just underneath the inner membrane. (E) 3-D segmentation with another cytoplasmic filament bundle colored orange. The box identifies a region referred to in Figure 9C.
Figure 5
Figure 5
Arc-like filaments persist in the presence of A22. Low magnification cryo-EM views (A, C) and corresponding segmented 3-D reconstructions (B, D) of a NA1000 cell (A, B) and a cell overexpressing FtsZG109S (C, D), both after treatment with A22, again showing arc-like filaments. Scale bar in (A) 500 nm. For scale in (C), the circular hole in the carbon support film on the EM grid has a diameter of 1.3 μm. See also supporting fLM studies in Supplementary Figure S10.
Figure 6
Figure 6
FtsZ filaments are on average 16 nm away from the membrane. Density profiles through the cell wall of a cell overexpressing FtsZG109S in the region of an extended division site containing FtsZ filaments (lower curve) and a random, unconstricted region of one NA1000 cell body not containing FtsZ as a control (top curve). The horizontal axis is the distance either outside (negative numbers) or inside (positive numbers) the inner membrane. The surface layer (SL), outer membrane (OM), peptidoglycan (PG), inner membrane (IM), and FtsZ filament layers can be resolved.
Figure 7
Figure 7
Connections between FtsZ filaments and the cell wall. (A–H) 6.7 nm slices containing individual FtsZ filaments. (A′–H′) Corresponding interpretive 3-D segmentations. The different panels show a smoothly curved filament without apparent connections to the cell wall (A), filaments connected to the inner membrane in their midsections (B and C), a filament connected to the peptidoglycan (D), filaments connected to the membrane at their termini (E and F), a filament tightly following the curvature of an indentation in the membrane (G), and a filament unusually close to the membrane with multiple connections (H). Panels B (B′) and G (G′) are NA1000 cells, the other panels are cells overexpressing FtsZG109S. Scale bar 50 nm.
Figure 8
Figure 8
Lateral spacing of FtsZ filaments in cells overexpressing FtsZG109S. (A) 6.7 nm ‘glancing' slice just inside the inner membrane of the cell overexpressing FtsZG109S depicted in Figure 5C showing a flat ribbon of six adjacent filaments. (B) Power spectrum of the boxed area in panel (A). The single pair of prominent peaks reveals the average distance between filaments as 9.3 nm. (C) Volume-rendering of the same ribbon of filaments in red, allowing the relative density of all the voxels of the 3-D structure to be perceived without interpretive segmentation. In the background, the inner membrane is surface-rendered in blue.
Figure 9
Figure 9
Orientation of FtsZ filaments. (A) 3-D segmentation superimposed on a ‘glancing' slice through the reconstruction of the extended division site of a cell overexpressing FtsZG109S. Pitch (θ) was defined as the angle of the plane of each filament with respect to the long axis of the cell. (B) Pitches of observed filaments from three cells overexpressing FtsZG109S (182 filaments), 11 NA1000 cells (36 filaments), and two cells overexpressing (wild-type) FtsZ (30 filaments). (C) Two orthogonal views of a segmentation of the volume boxed in Figure 4E, showing that FtsZ filaments did not form closed rings, but rather interlaced spirals. Here each filament is surface-rendered in a different color.
Figure 10
Figure 10
Straight and curved segments of FtsZ filaments. 6.7 nm slices containing example straight and curved segments of FtsZ filaments. Abrupt ‘kinks' were sometimes seen (black arrows) as well as direct connections of straight filaments to the membrane (white arrowheads). Panels (G) and (H) are NA1000 cells, the other panels (A–F) are cells overexpressing FtsZ G109. Scale bar 50 nm.
Figure 11
Figure 11
An ‘iterative pinching' model for the role of FtsZ in cell division. Cytosolic GTP-bound FtsZ monomers (red squares, upper left) polymerize into straight filaments (red lines, upper right) and bind to the inner membrane (blue circle) through anchor proteins (orange hooks). GTP hydrolysis drives a conformational change to a curved filament (lower right), pinching the membrane inwards slightly in that region. GDP-bound FtsZ monomers depolymerize (red circles, lower left), and then exchange their nucleotide to complete the cycle. While FtsZ filaments are usually short and span only a chord within the circle (radius R) rather than a complete ring or inscribed polygon, the constricting effect of the conformational change can be appreciated by considering a hypothetical polygon and a corresponding circle of equal circumference (dashed purple lines with radius slightly less than R). The resulting small constrictions in each round could be stabilized before the filaments depolymerize by the construction of new peptidoglycan behind the advancing membrane.

Similar articles

Cited by

References

    1. Addinall SG, Lutkenhaus J (1996) FtsZ-spirals and -arcs determine the shape of the invaginating septa in some mutants of Escherichia coli. Mol Microbiol 22: 231–237 - PubMed
    1. Anderson DE, Gueiros-Filho FJ, Erickson HP (2004) Assembly dynamics of FtsZ rings in Bacillus subtilis and Escherichia coli and effects of FtsZ-regulating proteins. J Bacteriol 186: 5775–5781 - PMC - PubMed
    1. Begg KJ, Donachie WD (1985) Cell shape and division in Escherichia coli: experiments with shape and division mutants. J Bacteriol 163: 615–622 - PMC - PubMed
    1. Ben-Yehuda S, Losick R (2002) Asymmetric cell division in B. subtilis involves a spiral-like intermediate of the cytokinetic protein FtsZ. Cell 109: 257–266 - PubMed
    1. Bi EF, Lutkenhaus J (1991) FtsZ ring structure associated with division in Escherichia coli. Nature 354: 161–164 - PubMed

Publication types

MeSH terms