. 2007 Dec 20;505(6):716-37.
doi: 10.1002/cne.21533.

Neuropathogical features of a rat model for perinatal hypoxic-ischemic encephalopathy with associated epilepsy

Affiliations

Neuropathogical features of a rat model for perinatal hypoxic-ischemic encephalopathy with associated epilepsy

Shilpa D Kadam et al. J Comp Neurol. .

Abstract

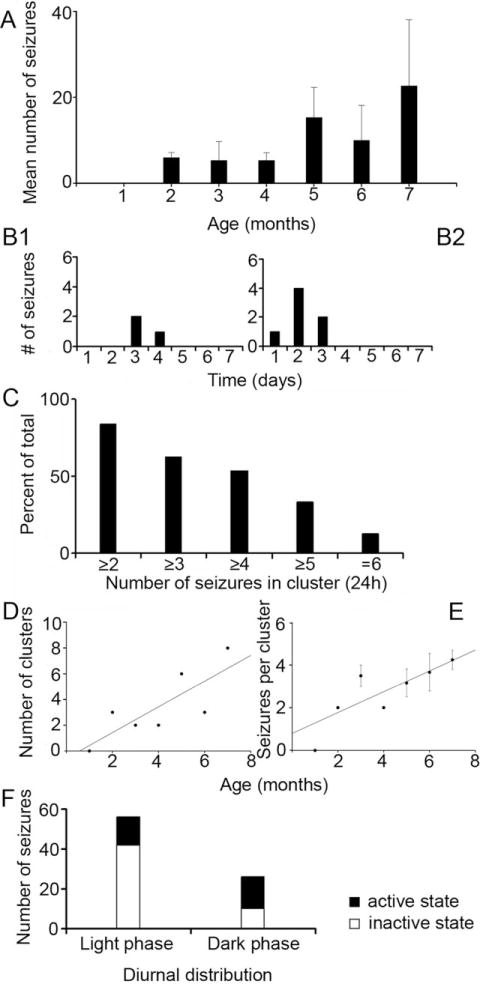
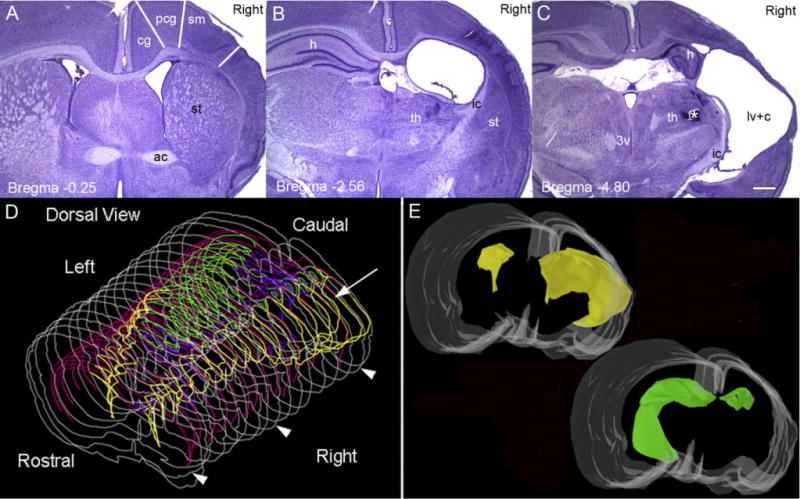
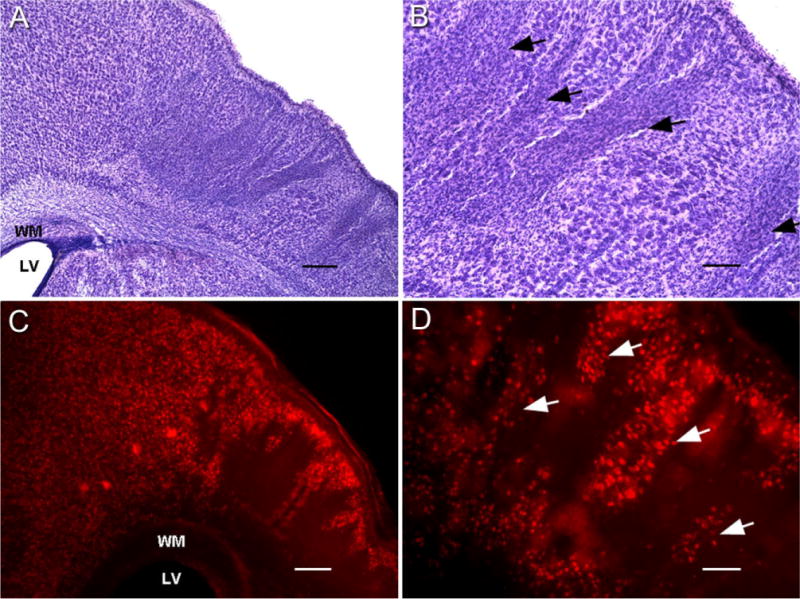
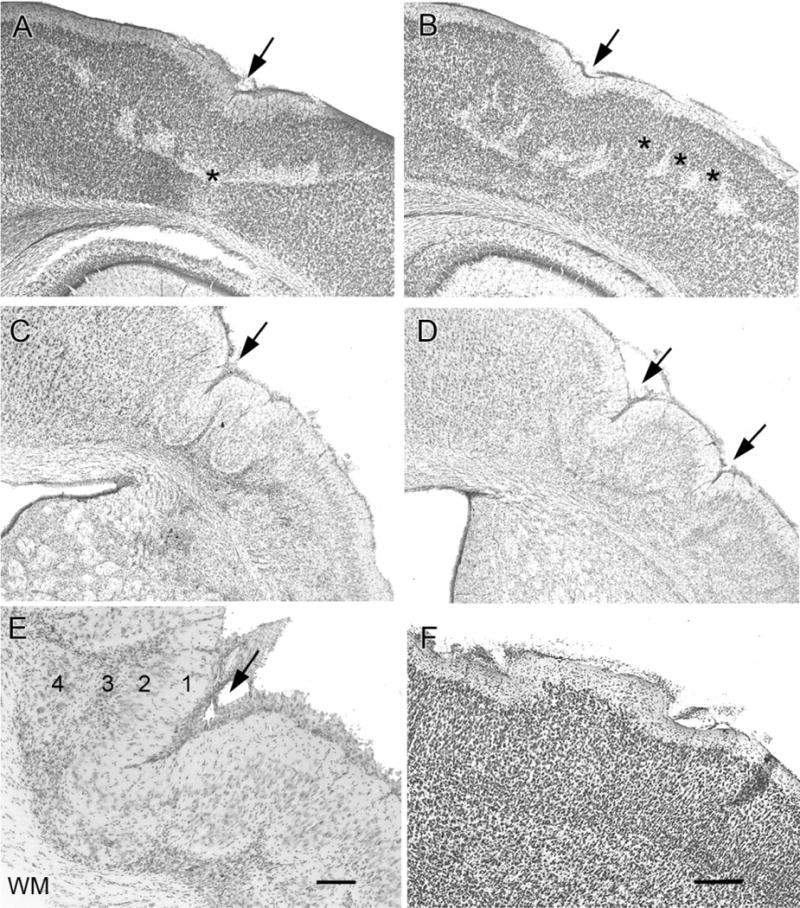
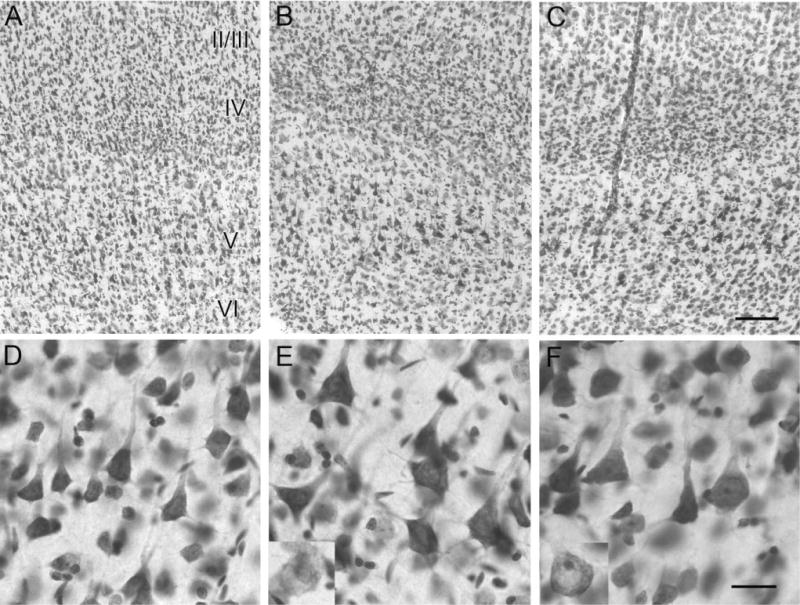
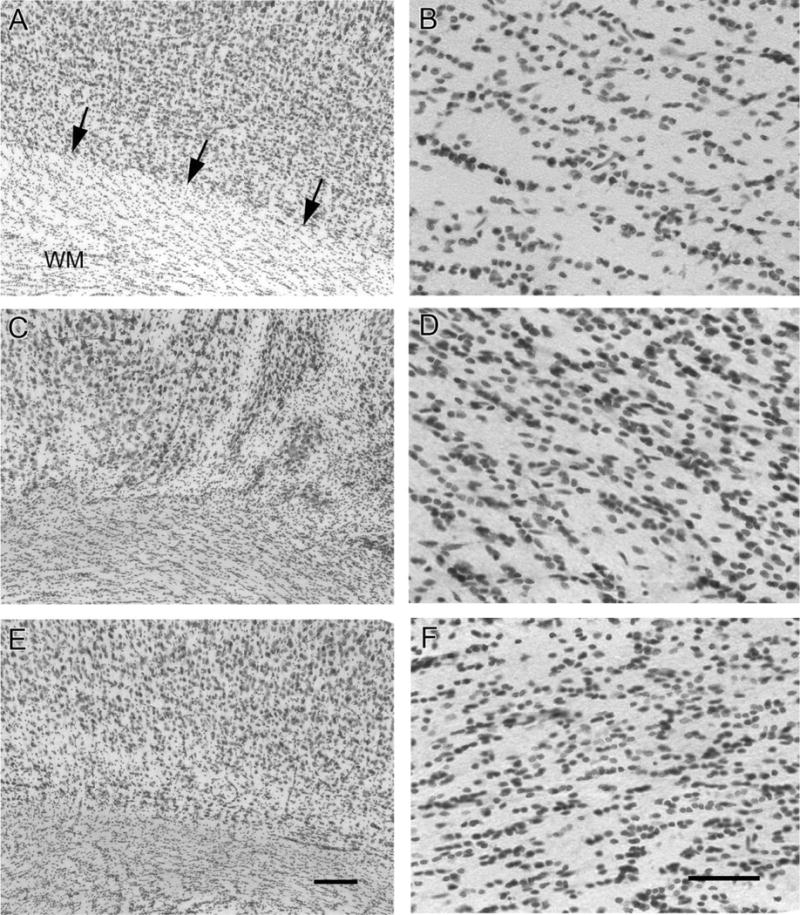
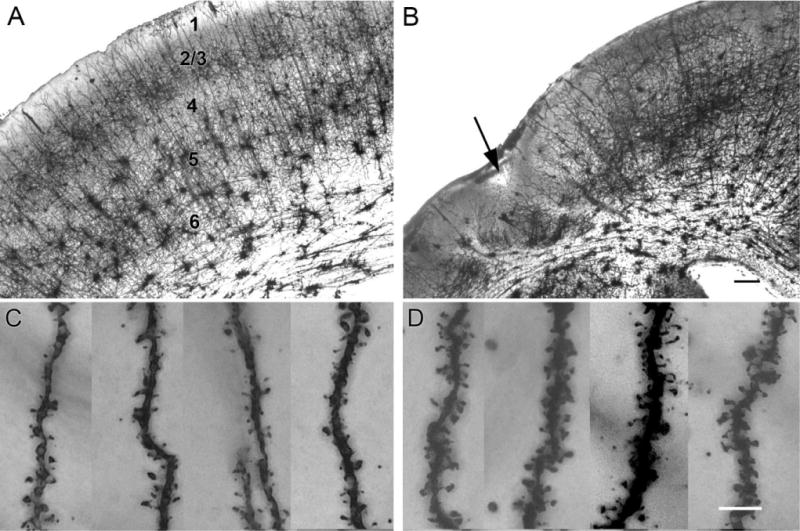
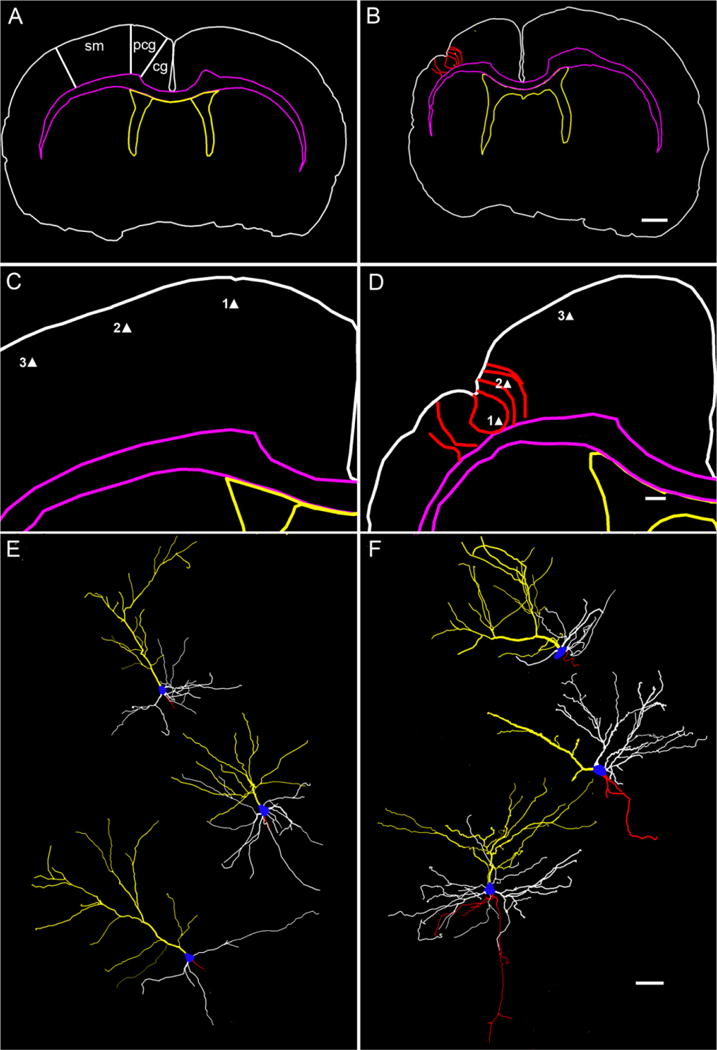
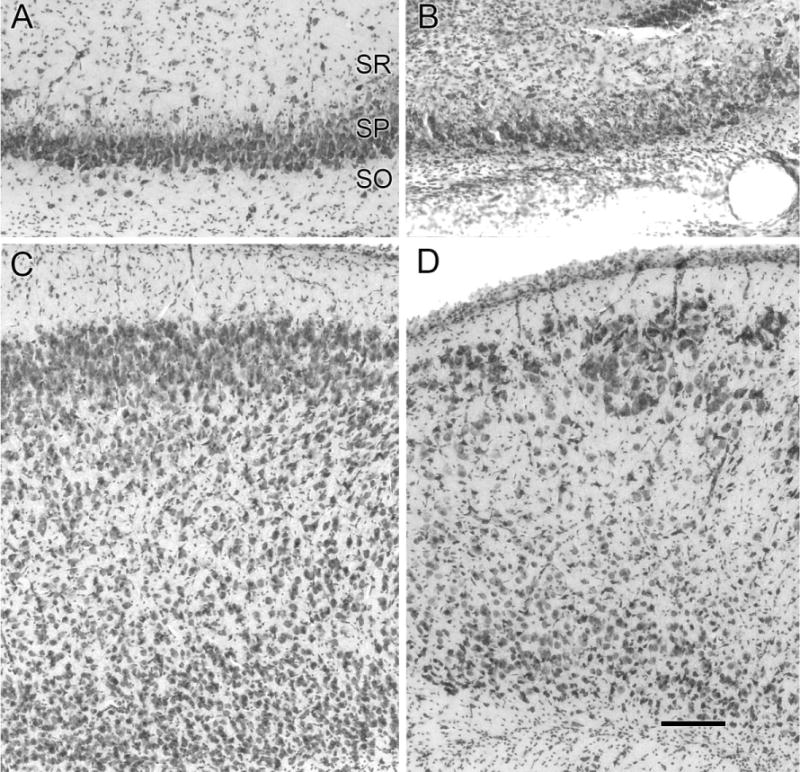
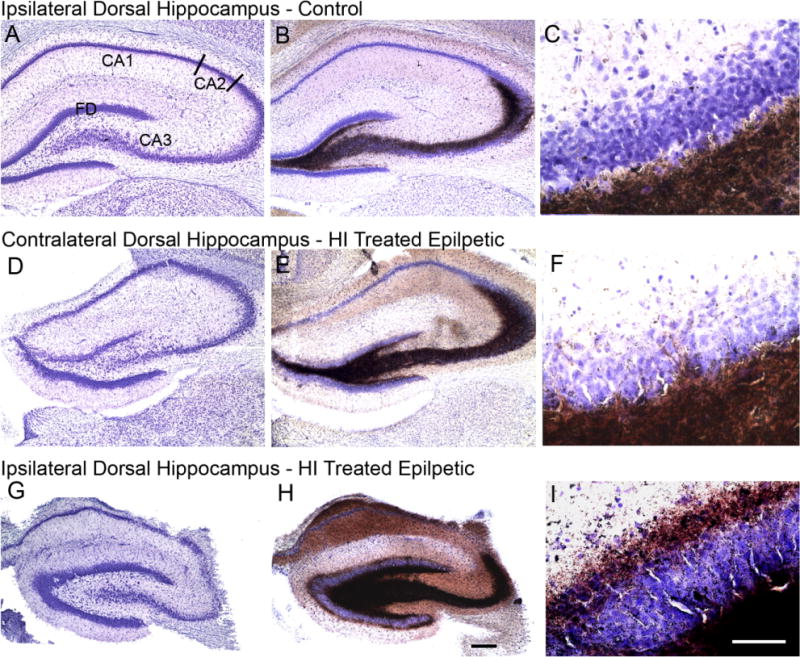
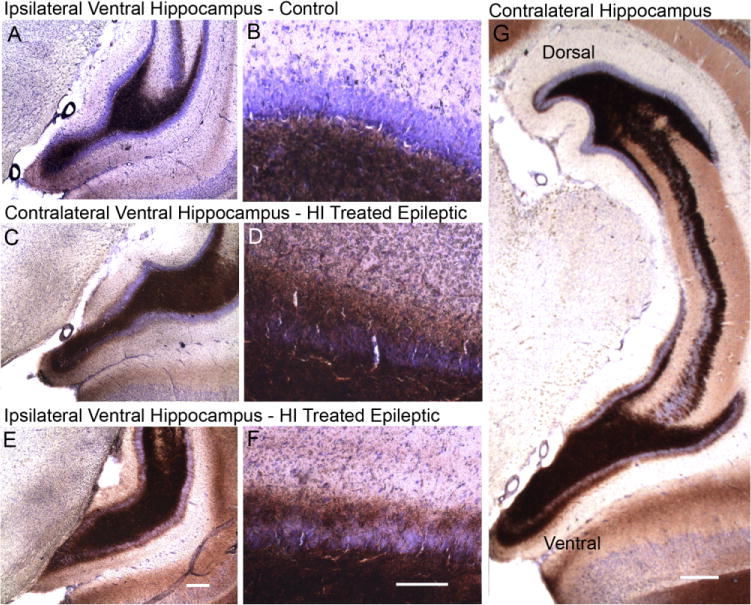
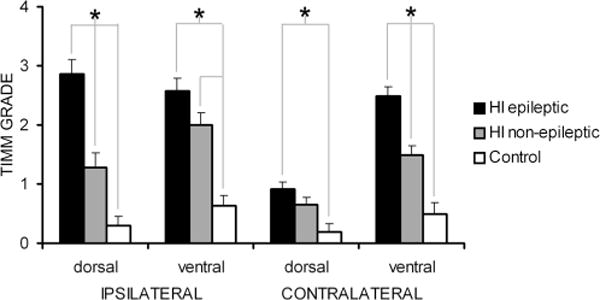
Hypoxic-ischemic (HI) encephalopathy is an important neurological problem of the perinatal period. Little is known of the long-term progression of HI insults or the maladaptive changes that lead to epilepsy. Using rats with unilateral carotid occlusion followed by hypoxia at postnatal day 7, this study provides an initial analysis of the epilepsy caused by a perinatal HI insult with chronic and continuous behavioral monitoring. The histopathology was investigated at postnatal day 30 and later at > or =6 months of age using cresyl violet, Timm, and rapid Golgi staining and immunocytochemistry. The resultant epilepsy showed an increase in seizure frequency over time, with a preponderance for seizure clusters and behavioral features of an ipsilateral cerebral syndrome. In addition to parasagittal infarcts and porencephalic cysts in severe lesions, columnar neuronal death was found with cytomegaly in isolated groups of dysmorphic cortical neurons. Cortical dysgenesis was seen in the form of deep laminar cell loss, microgyri, white matter hypercellularity, and blurring of the white and gray matter junction. Mossy fiber sprouting was not only detected in the atrophied ipsilateral dorsal hippocampus of HI rats with chronic epilepsy, but was also found in comparable grades in spared ipsi- and contralateral ventral hippocampi. The cortical lesions in this animal model show histological similarities with those found in humans after perinatal HI. The occurrence of cortical abnormalities that are associated with epilepsy in humans correlates with the consequent detection of spontaneous recurrent seizures.


Figures

Fig. 1
Fig. 1
Progressive increases in post-HI seizure frequencies and occurrence of seizure clusters in rats that were detected to be epileptic. A: Mean number of Class 3, 4, and 5 (Racine scale) seizures detected with the 1-week-per-month video-monitoring protocol for rats that were found to have recurrent spontaneous seizures (n/n = 3/10). Histogram shows means counts for three HI-treated rats, which showed an increase in recurrent spontaneous seizures over the 7 consecutive months of video-monitoring. Data from the second and third month (B1 and B2, respectively) of monitoring for an individual epileptic HI-treated rat showed clustering of seizures within 24-hour periods in the 7-day monitoring protocol. The data in B2 show an increase in the number of seizures within the detected cluster compared to the cluster detected in B1. The histogram in C shows the percent of seizures occurring as clusters (within a 24-hour period) as a function of the minimum number of seizures in the cluster over the 7-month period. Thus, about 84% of the seizures were associated with at least one other seizure in a 24-hour period and 54% of the seizures were part of a cluster of four or more seizures. A gradual increase in the number of clusters (≥2 seizures in 24 hours; D) and in the number of seizures within a cluster (normalized to number of clusters, E) was observed as a function of time. F: Diurnal distribution of seizure occurrence and dependence on activity state. A stacked histogram shows the diurnal variation of total ictal events (≥Class 3) detected, presented as seizures occurring during the light phase (n = 52) versus the dark phase (n = 30) that was not statistically significant (P > 0.1). The data are further differentiated by seizures that occurred when the animal was active or inactive within the respective phase of the diurnal cycle. Activity dependence was significant during the light phase (P = 0.001).
Fig. 2
Fig. 2
Location of cystic infarct. A–C: Cresyl-violet-stained coronal sections from a P30 rat following the HI insult at P7. A1, 2, and 3 are images of 40-μm coronal sections shown in reference to bregma and demonstrate the core of the infarct in the parasagittal zone of the right hemisphere. In the section through the anterior commissure (ac) at −0.25 bregma (A), the lateral ventricles (lv) are seen bilaterally and are comparable in size. Striatal (st) atrophy is evident in right (ipsilateral) hemisphere. Columnar bands of cell death are seen predominantly in the sensorimotor cortex (sm) with a relatively preserved cingulate (cg) and paracingulate cortex (pcg). The sm and pcg cortices are both parasagittal in location with the pcg cortex being more medial in location (Paxinos and Watson, 1998). In the section through dorsal hippocampus (h) at −2.56 bregma (B), right thalamic (th) atrophy was especially marked in the dorsolateral nuclei. The right dorsal hippocampus is conspicuously absent in this section, and replaced with an enlarged lateral ventricle lined with an ependymal layer and a visible choroid plexus. The section through the posterior thalamus at −4.80 bregma (C) shows mineralized lesions in the region of the ventral posteromedial thalamic nucleus (asterisk); the cystic infarct (c) has coalesced with the lateral ventricle to form a porencephalic cyst and the third ventricle is undilated. D,E: Serial reconstruction using Virtual Slice software in Neurolucida representing the rostrocaudal dimensions of the cystic infarct. The 3D dorsal view of the wireframe generated by serial reconstruction is shown in D and anatomical structures are color coordinated with 3D reconstructions in E to assist visualization within the wireframe. The cystic infarct fused with the lateral ventricle (yellow) is seen in the right cerebral hemisphere predominantly in the middle and posterior cerebral artery vascular territory (arrow). Arrowheads represent the sections shown in A, B, and C along the rostrocaudal axis, respectively. A solid model of the reconstructed lesioned brain in the same orientation as in D is shown in E. A basofrontal view allows better visualization of the asymmetry of the lateral ventricles (yellow), with the ipsilateral lateral ventricle coalescing with the infarct cyst to form the porencephalic cyst (as seen in D). The severely atrophied dorsal hippocampus (green, also seen in wireframes in D) in the ipsilateral hemisphere is seen in comparison to the contralateral hippocampus. Color code for D and E: white, section contour / cerebral surface; pink, corpus callosum; yellow, porencephalic cyst merged with lateral ventricle; green, hippocampus; purple, third and fourth ventricles. Scale bar = 500 μm in C (applies to A,B).
Fig. 3
Fig. 3
Columnar cell death visualized with cresyl violet and NeuN immunocytochemistry at P30. Coronal section of cresyl-violet-stained sensorimotor cortex shows the core of the infarct with columnar cell death at lower magnification (A). At higher magnification, columns of surviving gray matter separate bands of scarred neocortex (arrows, B). NeuN-stained 40-μm coronal sections demonstrate the marked dorsal border of the infarct that lies between the spared paracingulate cortex (anterior cerebral artery perfusion) and the “watershed zone” delineated by a massive loss of neurons in the parasagittal neocortex (C). Magnified view (D) shows columns of NeuN-positive surviving neurons (arrows) separated by bands of tissue devoid of any stained cells (corresponding to the bands of scar tissue in the cresyl-violet-stained sections in A,B). WM, white matter; LV, lateral ventricle. Scale bars = 250 μm in A,B; 100 μm in C,D.
Fig. 4
Fig. 4
Dislamination of parasagittal cortex. Coronal cresyl-violet-stained sections showing deep laminar cell loss at P30 (A,B) and microgyri in the chronic (≥6 month age) group of HI-treated rats (C–E). A: Early stages of the possible progressive collapse (arrow) of the neocortex to a microgyrus at the cortical surface overlying the deep laminar cell loss (asterisk). The pattern of patchy deep laminar cell loss coincides with the columnar predilection to cell death that was commonly observed (B), which is likely linked to immaturity of the cerebral vasculature (three asterisks) at the time of the HI. C: The presence of acquired microgyral-like structures (arrows) in tissue fixed from a chronically epileptic rat (age >6 months). D: Two such microgyri are seen, compared to the one microgyrus seen in C. The rat that generated the section in D also had twice as many seizures compared to the rat with the section in C, as determined with a continuous and chronic recording of electroencephalograms. E: A microgyrus from an epileptic rat is shown at higher magnification to demonstrate the collapse of the neocortex into a four-layered structure. Layer 1 is contiguous with the molecular layer of the undamaged cortex and fuses to form a microsulcus (arrow). Layer 2 is contiguous with layers II and III of undamaged cortex, but is unlaminated. Layer 3 is the scar that is the remnant of the original injury and hence also called lamina dissecans. Layer 4 is contiguous with layer 5 of intact cortex. F: Cortical surface irregularities were accompanied by underlying cell death, and could be compared to cortical warts where layer II/III neurons protrude along with the molecular layer above a normally lissencephalic brain. WM, white matter. Scale bars = 250 μm in F (applies to A–D); 100 μm in E.
Fig. 5
Fig. 5
Cresyl-violet-stained coronal sections showing cytomegalic neurons in deep laminar layers of the spared paracingulate neocortex. All panels show paracingulate neocortex with layer II/III at the top of the panel and layer VI at the base (A–C; ≈3.3 mm caudal to bregma [Paxinos and Watson, 1998]) with the lower panels showing the respective deeper layers at higher magnification (D–F). Compared to control (A), ipsi- (B), and contralateral (C) neocortex showed the presence of cortical dysplasia in the form of hypertrophic, strongly Nissl-stained pyramidal neurons and lightly stained misshapen and/or cytomegalic neurons (insets in E and F) in the deep laminar layers (compare D [control] to E and F [ipsi- and contralateral, respectively]). Scale bars =100 μm in C (applies to top row); 50 μm in F (applies to bottom row).
Fig. 6
Fig. 6
Layer VI /white matter (WM) junction dysplasia and WM hypercellularity. The left panels show the layer VI/WM junction of the parasagittal sensorimotor neocortices and the right panels are magnified views of the WM underlying the sensorimotor cortices at the corresponding locations of the left panels. The normal distinct layer VI/WM junction (arrows) is seen in a control rat (A), while blurring of this junction was noted in the ipsilateral (C) and contralateral (E) sensorimotor neocortex of an HI-treated epileptic rat. Note the hypercellularity of the WM underlying the HI-treated ipsi- and contralateral cortex (D,F, respectively) compared to control (B). Scale bars = 100 μm in E (applies to A,C); 25 μm in F (applies to B,D).
Fig. 7
Fig. 7
Dislamination of spared paracingulate cortex as revealed by the rapid-Golgi stain. The upper panels show low-magnification images of control (A) and HI-treated neocortex (B), and the lower panels are high-magnification images showing the corresponding apical dendrites and spines. A: Golgi-stained paracingulate neocortex from a control rat shows isocortical cytoarchitecture, starting outside with the molecular layer I, followed by the outer granular and pyramidal layer (II/III), the inner granular layer IV, the inner pyramidal layer V, and mutiforme layer VI followed by corpus callosal white matter tract. B: The ipsilateral Golgi-stained section from an HI-treated brain with a parasagittal microgyrus (arrow). Note the lack of Golgi staining in the bands of scar tissue around the microgyrus and the loss of laminar cytoarchitecture in the spared paracingulate cortex, which appeared comparatively laminar in cresyl-violet-stained sections. Pedunculate spines were seen on apical dendrites reaching the molecular layer from pyramidal neurons in layer II in control (C) and lesioned (D) sensorimotor neocortices. The distal apical dendrites from HI-treated rats showed an abundance of pedunculate and mushroom spines compared to control (counts done on 2D images of fused Z stack images in ImageJ [see Materials and Methods] were 42.3 ± 0.9 and 23.8 ± 1.9 per 25 μm distal dendrite, respectively, sample size =4 each) Scale bars = 250 μm in B (applies to A); 5 μm in D (applies to C).
Fig. 8
Fig. 8
Cortical neuronal morphologies revealed by neuronal reconstructions from rapid-Golgi-stained sections. Top panels show low-magnification traces of sections from control (A) and HI-treated rats (B). Regions of interest in the parasagittal zone (Paxinos and Watson, 1998) are marked in A: sensorimotor cortex (sm), cingulate (cg), and paracingulate cortex (pcg). Middle panels show higher magnification of the traces in the top panels from the corresponding right parasagittal neocortices. Bottom panel shows the dysmorphic features of reconstructed layer II/III pyramidal neurons from HI-treated sections compared to corresponding neurons from control sections. The tracing of a Golgi-stained 200-μm coronal section from control and HI-treated rats (color code same as in Fig. 2D) shows bilateral symmetry in control (A) and atrophied ipsilateral hemisphere with a microgyri in the sensorimotor cortex (red) in a lesioned rat (B). In contrast to control (C), the presence of a parasagittal microgyrus and the surrounding gliotic bands are traced (red contours) in D to give reference to the location of the reconstructed pyramidal neurons (i.e., solid triangles 1, 2, and 3). The reconstructed pyramidal neurons are depicted in the exact dorsoventral orientation they were found in the coronal sections and are shown in a numerically ascending order from top to bottom (control [E] and HI-treated [F], respectively). Neuron 1 from HI-treated rat (F) is a displaced layer II/III neuron showing a dominant apical dendritic tree (yellow) with basal dendrites (white) running along the curvature formed by the pit of the microgyrus. Neuron 2 is a layer II/III neuron adjacent to the microgyrus bordering a gliotic band. It shows a sparsely branched apical dendrite running along the gliotic band toward the molecular layer and a unilateral tree of basal dendrites directed away from the gliotic band and toward the parainfarct cortex. Neuron 3 is a layer II/III layer pyramidal neuron in the parainfarct sensorimotor cortex with a well-formed apical and basal dendritic tree and axon collaterals (red); cell body, blue; apical dendrite, yellow; basal dendrite, white; axon, red. Scale bars = 1 mm in B (applies to A); 250 μm in D (applies to C); 50 μm in F (applies to E).
Fig. 9
Fig. 9
Cell loss in the dorsal hippocampus and the entorhinal cortex. Cresyl-violet-stained coronal sections of the ipsilateral dorsal hippocampus (A,B) and entorhinal cortex (C,D) with the molecular layer I, at the top of the panels are shown. Neurons in the stratum pyramidale (SP) are seen populating the CA3 region of the right hippocampus in a control rat (A). Massive loss of neurons is shown in the corresponding CA3 region in an HI-treated rat (B). Note the proliferation of cells in the stratum oriens (SO) and stratum radiatum (SR) in the HI-lesioned section that may be due to reactive gliosis. Compared to control (C) the entorhinal cortex shows laminar loss of neurons marked by the superficial presence of large neurons normally located in the deeper layers in the section from an HI-treated epileptic rat (D). Note the thinning/obliteration of the molecular layer I in D. Scale bars = 50 μm in D (applies to A–C).
Fig. 10
Fig. 10
Representative coronal cresyl-violet and Timm-stained-sections focusing on the ipsi- and contralateral dorsal hippocampi. Top and bottom panels show ipsilateral cresyl-violet (A,G), Timm-stained sections (B,H) and magnified views of the inner molecular layer of the dentate gyrus (C,I) from a control and HI-treated epileptic rat, respectively. Middle panel shows the corresponding contralateral sections from the same HI-treated epileptic rat as shown in panel C (D–F). The dorsal hippocampus from a control rat (A) shows fascia dentata (FD) and the Ammon’s horn (CA3, CA2, and CA1). The Timm stained section shows dark brown precipitate in the region of mossy fiber innervation (B). Grade 0 Timm stain product is seen in dentate inner molecular layer (C). The contralateral dorsal hippocampus (D) shows no apparent cell loss of CA3 neurons. Timm stain shows a more robust distribution compared to control (E) and minimal (grade 1) stain product is seen in dentate inner molecular layer (F). Massive loss of lateral CA3 neurons causing a distinct demarcation between the CA3 and CA2 (relatively spared) junction is seen in the ipsilateral region of the epileptic rat (G); note the relative preservation of the fascia dentata (FD) medial CA3 and hilar neurons. Robust innervation of the CA3 region till the CA3/CA2 junction by mossy fibers masks presence of the few surviving neurons in the region by cresyl violet counterstain (H). The dentate inner molecular layer shows grade 3 stain product (I); note atrophy of ipsilateral dorsal hippocampus in ipsilateral compared to the contralateral and control sections. Scale bars = 250 μm in H (applies to A,B,D,E,G); 50 μm in I (applies to C,F).
Fig. 11
Fig. 11
Representative coronal Timm-stained sections focusing on the ipsi- and contralateral ventral hippocampi. Top and bottom panels show ipsilateral Timm stained sections (A,E) and magnified views of the inner molecular layer of the dentate gyrus (B,F) from a control and HI-treated epileptic rat, respectively. Middle panel shows the corresponding contralateral sections from the same HI-treated epileptic rat as shown in E (C,D). The ventral hippocampus from a control rat (A) shows Timm staining in the dentate hilus and grade 0-1 stain product in the dentate inner molecular layer (B). A more robust stain product is seen in both C and E with grade 3 staining (D,F) in the dentate inner molecular layer bilaterally. Contralateral Timm stain showed a differential grade of stain in the dorsal versus ventral hippocampus of epileptic rats. A representative coronal section from an epileptic rat (G) showing grade 1 compared to grade 3 of Timm stain in the dentate inner molecular of the dorsal hippocampus at the top of the panel and the ventral hippocampus in the bottom of the panel, respectively. Scale bars = 250 μm in E (applies to A,C); 100 μm in F (applies to B,D); 500 μm in G.
Fig. 12
Fig. 12
Comparison of Timm stain grades in the dentate inner molecular layer of ipsi- and contralateral dorsal and ventral hippocampi of i) HI-treated rats that were detected to be epileptic (n = 11); ii) HI-treated rats that were not detected to be epileptic (n = 14); iii) sham control rats (n = 12). Significant differences between groups for each anatomical location are indicated by asterisks.

Similar articles

Cited by

References

    1. Alonso-Nanclares L, Garbelli R, Sola RG, Pastor J, Tassi L, Spreafico R, DeFelipe J. Microanatomy of the dysplastic neocortex from epileptic patients. Brain. 2005;128:158–173. - PubMed
    1. Andres M, Andre VM, Nguyen S, Salamon N, Cepeda C, Levine MS, Leite JP, Neder L, Vinters HV, Mathern GW. Human cortical dysplasia and epilepsy: an ontogenetic hypothesis based on volumetric MRI and NeuN neuronal density and size measurements. Cereb Cortex. 2005;15:194–210. - PubMed
    1. Andrews RJ. Transhemispheric diaschisis. A review and comment. Stroke. 1991;22:943–949. - PubMed
    1. Ansari MQ, Chincanchan CA, Armstrong DL. Brain calcification in hypoxic-ischemic lesions: an autopsy review. Pediatr Neurol. 1990;6:94–101. - PubMed
    1. Armstrong DD, Mizrahi EM. Pathologic basis of the symptomatic epilepsies in childhood. J Child Neurol. 1998;13:361–371. - PubMed

Publication types

MeSH terms

Substances