

Solvent reaction field potential inside an uncharged globular protein: a bridge between implicit and explicit solvent models?
- PMID: 17949217
- PMCID: PMC2556216
- DOI: 10.1063/1.2771171
Solvent reaction field potential inside an uncharged globular protein: a bridge between implicit and explicit solvent models?
Abstract
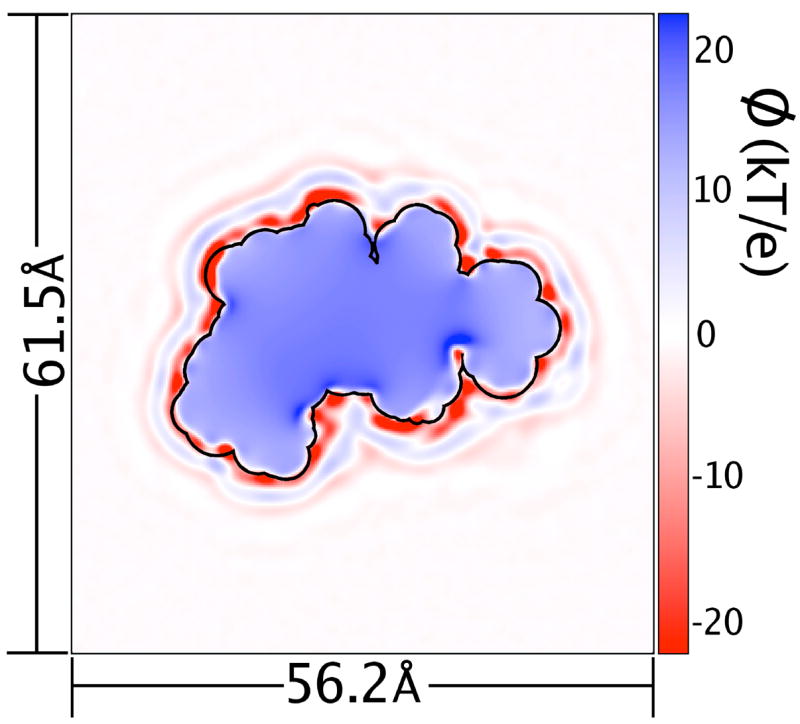
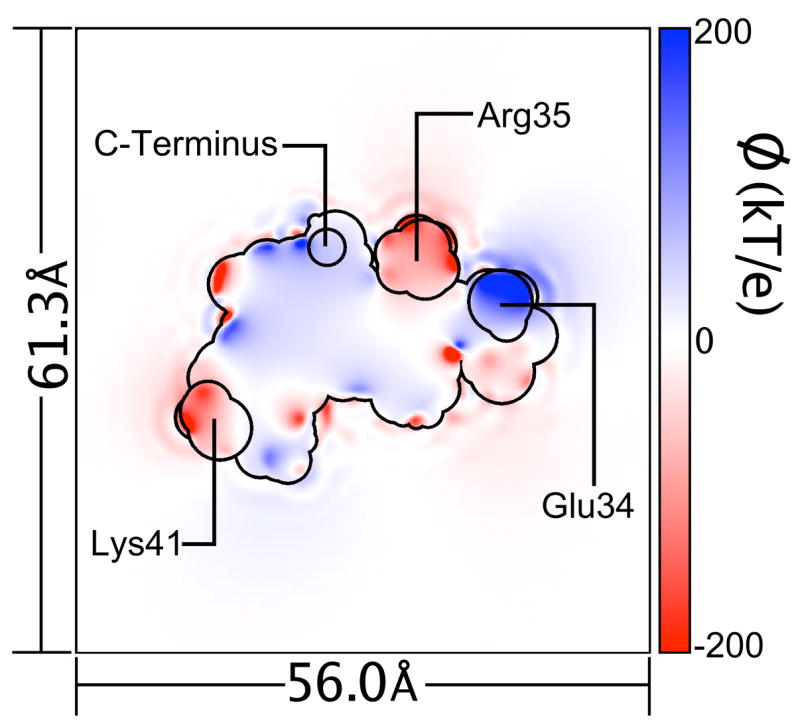
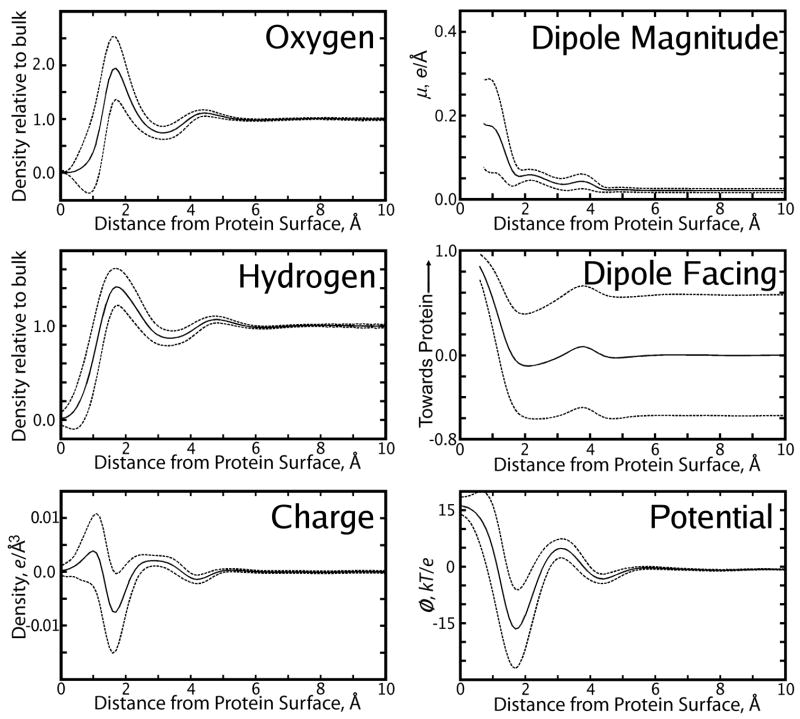
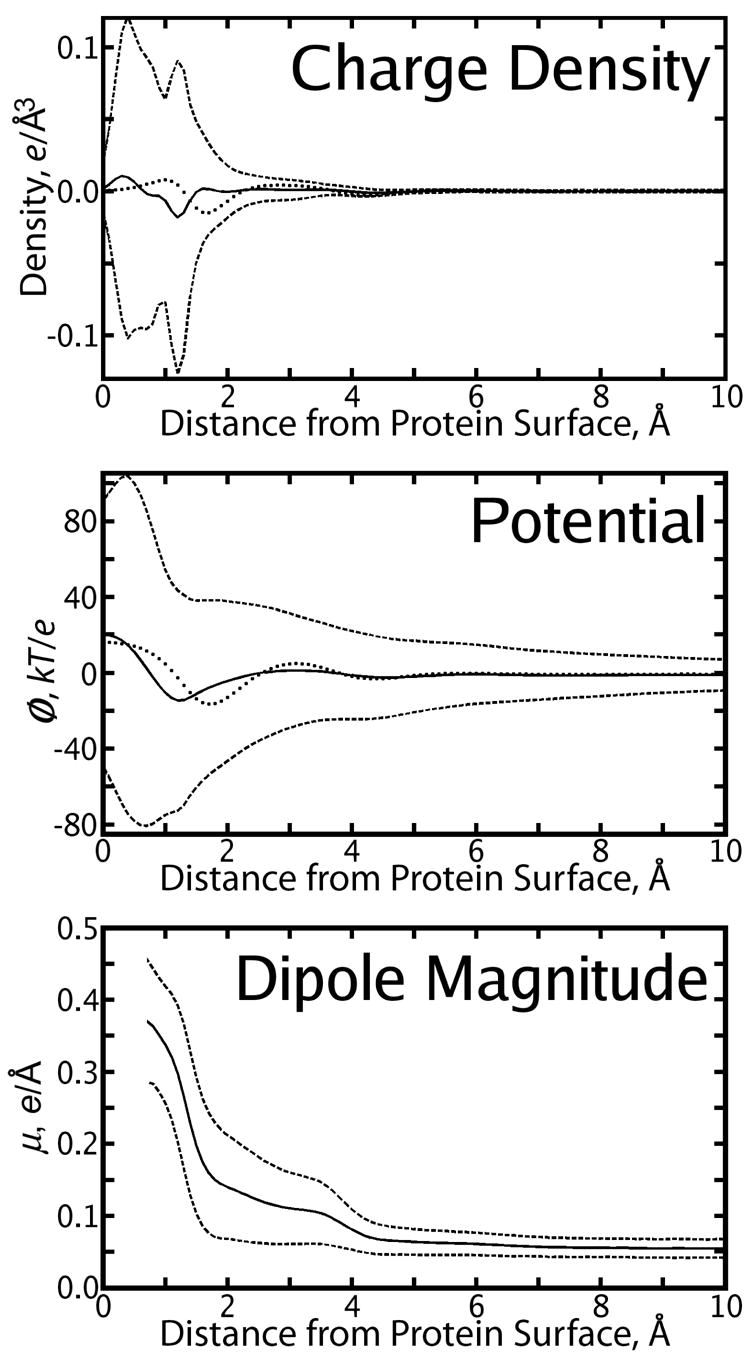
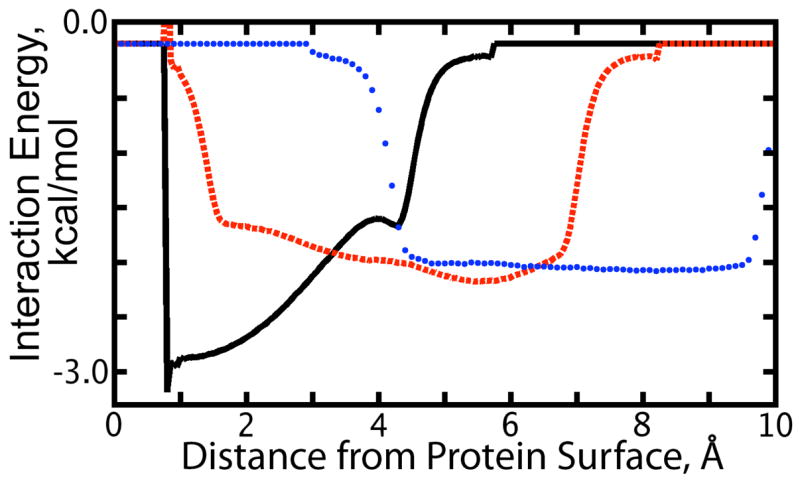
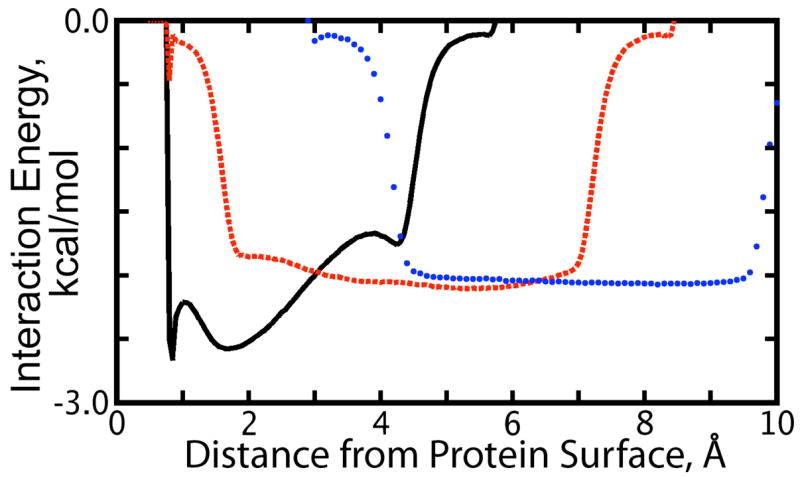
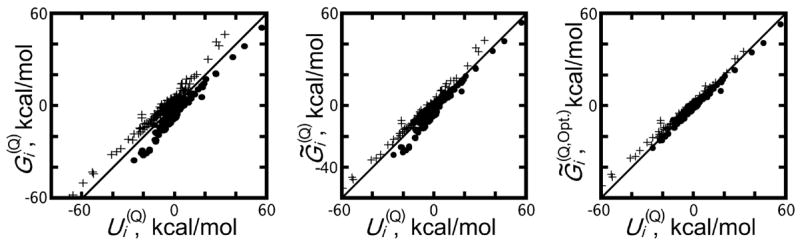
The solvent reaction field potential of an uncharged protein immersed in simple point charge/extended explicit solvent was computed over a series of molecular dynamics trajectories, in total 1560 ns of simulation time. A finite, positive potential of 13-24 kbTec(-1) (where T=300 K), dependent on the geometry of the solvent-accessible surface, was observed inside the biomolecule. The primary contribution to this potential arose from a layer of positive charge density 1.0 A from the solute surface, on average 0.008 ec/A3, which we found to be the product of a highly ordered first solvation shell. Significant second solvation shell effects, including additional layers of charge density and a slight decrease in the short-range solvent-solvent interaction strength, were also observed. The impact of these findings on implicit solvent models was assessed by running similar explicit solvent simulations on the fully charged protein system. When the energy due to the solvent reaction field in the uncharged system is accounted for, correlation between per-atom electrostatic energies for the explicit solvent model and a simple implicit (Poisson) calculation is 0.97, and correlation between per-atom energies for the explicit solvent model and a previously published, optimized Poisson model is 0.99.
Figures
Similar articles
-
Evaluation of Poisson solvation models using a hybrid explicit/implicit solvent method.J Phys Chem B. 2005 Mar 24;109(11):5223-36. doi: 10.1021/jp046377z. J Phys Chem B. 2005. PMID: 16863188
-
Solvation forces on biomolecular structures: a comparison of explicit solvent and Poisson-Boltzmann models.J Comput Chem. 2004 Oct;25(13):1623-9. doi: 10.1002/jcc.20089. J Comput Chem. 2004. PMID: 15264256
-
How well does Poisson-Boltzmann implicit solvent agree with explicit solvent? A quantitative analysis.J Phys Chem B. 2006 Sep 21;110(37):18680-7. doi: 10.1021/jp063479b. J Phys Chem B. 2006. PMID: 16970499
-
Electrostatics calculations: latest methodological advances.Curr Opin Struct Biol. 2006 Apr;16(2):142-51. doi: 10.1016/j.sbi.2006.03.001. Epub 2006 Mar 15. Curr Opin Struct Biol. 2006. PMID: 16540310 Review.
-
Advances in implicit models of water solvent to compute conformational free energy and molecular dynamics of proteins at constant pH.Adv Protein Chem Struct Biol. 2011;85:281-322. doi: 10.1016/B978-0-12-386485-7.00008-9. Adv Protein Chem Struct Biol. 2011. PMID: 21920327 Review.
Cited by
-
Geometric and potential driving formation and evolution of biomolecular surfaces.J Math Biol. 2009 Aug;59(2):193-231. doi: 10.1007/s00285-008-0226-7. Epub 2008 Oct 22. J Math Biol. 2009. PMID: 18941751
-
Differential geometry based multiscale models.Bull Math Biol. 2010 Aug;72(6):1562-622. doi: 10.1007/s11538-010-9511-x. Epub 2010 Feb 19. Bull Math Biol. 2010. PMID: 20169418 Free PMC article.
-
Differential geometry based solvation model II: Lagrangian formulation.J Math Biol. 2011 Dec;63(6):1139-200. doi: 10.1007/s00285-011-0402-z. Epub 2011 Jan 30. J Math Biol. 2011. PMID: 21279359 Free PMC article.
-
Dielectric Boundary Forces in Numerical Poisson-Boltzmann Methods: Theory and Numerical Strategies.Chem Phys Lett. 2011 Oct;514(4-6):368-373. doi: 10.1016/j.cplett.2011.08.067. Chem Phys Lett. 2011. PMID: 22125339 Free PMC article.
-
Biomolecular electrostatics and solvation: a computational perspective.Q Rev Biophys. 2012 Nov;45(4):427-91. doi: 10.1017/S003358351200011X. Q Rev Biophys. 2012. PMID: 23217364 Free PMC article. Review.
References
-
- Lu Y, Yang CY, Wang S. Binding free energy contributions of interfacial waters in HIV-1 protease/inhibitor complexes. Journal of the American Chemical Society. 2006;128(36):11830–9. - PubMed
-
- Yoshida N, Phongphanphanee S, Maruyama Y, Imai T, Hirata F. Selective ion-binding by protein probed with the 3d-RISM theory. Journal of the American Chemical Society. 2006;128(37):12042–3. - PubMed
-
- Allison SA, Carbeck JD, Chen C, Burkes F. Electrophoresis of protein charge ladders: A comparison of experiment with various continuum primitive models. Journal of Physical Chemistry B. 2004;108(14):4516–4524.
-
- Bublitz GU, Boxer SG. Stark spectroscopy: Applications in chemistry, biology, and materials science. Annual Review of Physical Chemistry. 1997;48:213–42. - PubMed
Publication types
MeSH terms
Substances
Grants and funding
LinkOut - more resources
Full Text Sources
Miscellaneous