

Optimization of cDNA microarrays procedures using criteria that do not rely on external standards
- PMID: 17949480
- PMCID: PMC2147032
- DOI: 10.1186/1471-2164-8-377
Optimization of cDNA microarrays procedures using criteria that do not rely on external standards
Abstract
Background: The measurement of gene expression using microarray technology is a complicated process in which a large number of factors can be varied. Due to the lack of standard calibration samples such as are used in traditional chemical analysis it may be a problem to evaluate whether changes done to the microarray procedure actually improve the identification of truly differentially expressed genes. The purpose of the present work is to report the optimization of several steps in the microarray process both in laboratory practices and in data processing using criteria that do not rely on external standards.
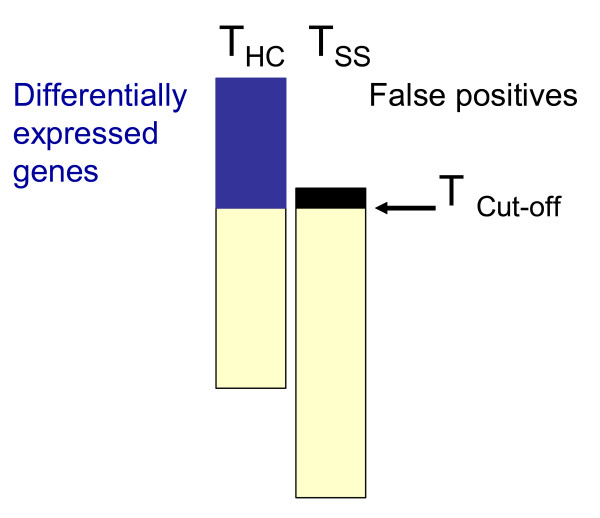
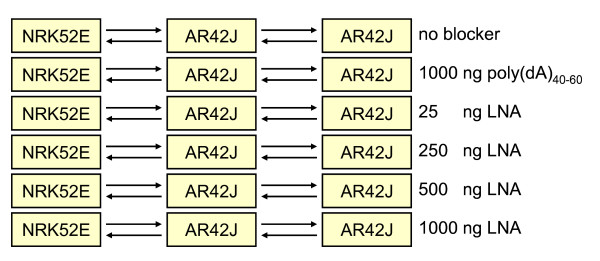
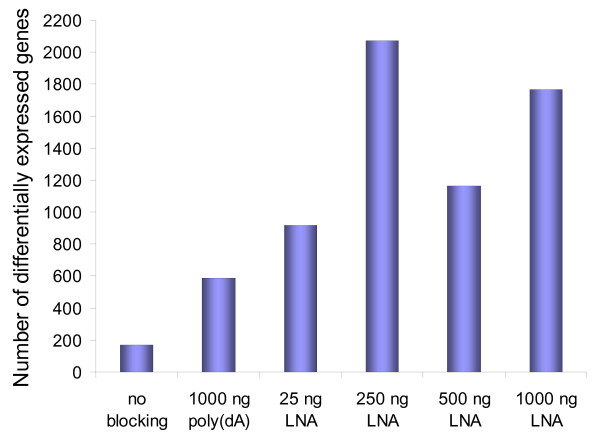
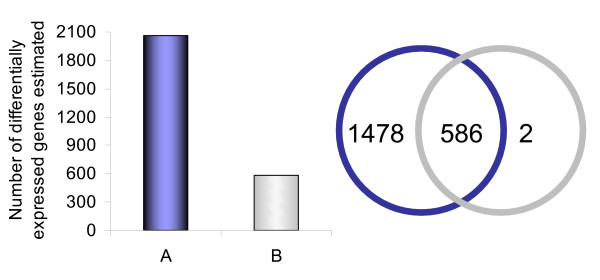
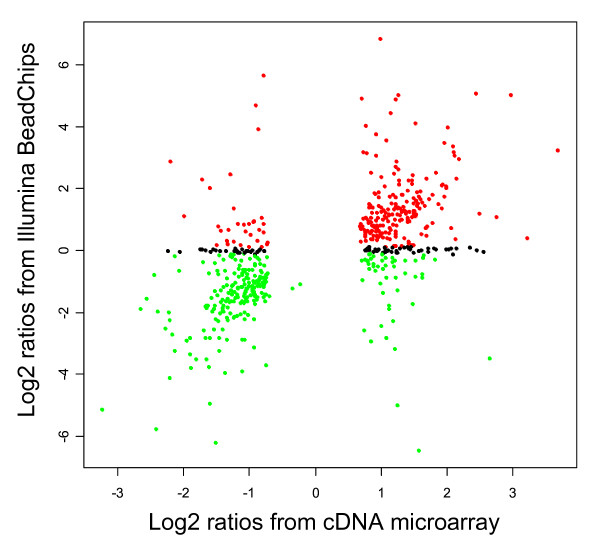
Results: We performed a cDNA microarry experiment including RNA from samples with high expected differential gene expression termed "high contrasts" (rat cell lines AR42J and NRK52E) compared to self-self hybridization, and optimized a pipeline to maximize the number of genes found to be differentially expressed in the "high contrasts" RNA samples by estimating the false discovery rate (FDR) using a null distribution obtained from the self-self experiment. The proposed high-contrast versus self-self method (HCSSM) requires only four microarrays per evaluation. The effects of blocking reagent dose, filtering, and background corrections methodologies were investigated. In our experiments a dose of 250 ng LNA (locked nucleic acid) dT blocker, no background correction and weight based filtering gave the largest number of differentially expressed genes. The choice of background correction method had a stronger impact on the estimated number of differentially expressed genes than the choice of filtering method. Cross platform microarray (Illumina) analysis was used to validate that the increase in the number of differentially expressed genes found by HCSSM was real.
Conclusion: The results show that HCSSM can be a useful and simple approach to optimize microarray procedures without including external standards. Our optimizing method is highly applicable to both long oligo-probe microarrays which have become commonly used for well characterized organisms such as man, mouse and rat, as well as to cDNA microarrays which are still of importance for organisms with incomplete genome sequence information such as many bacteria, plants and fish.
Figures

Similar articles
-
Identification of differentially-expressed genes potentially implicated in drought response in pitaya (Hylocereus undatus) by suppression subtractive hybridization and cDNA microarray analysis.Gene. 2014 Jan 1;533(1):322-31. doi: 10.1016/j.gene.2013.08.098. Epub 2013 Sep 27. Gene. 2014. PMID: 24076355
-
Expression microarrays in plant-virus interaction.Methods Mol Biol. 2008;451:583-613. doi: 10.1007/978-1-59745-102-4_40. Methods Mol Biol. 2008. PMID: 18370283
-
Evaluation of reference-based two-color methods for measurement of gene expression ratios using spotted cDNA microarrays.BMC Genomics. 2006 Feb 24;7:35. doi: 10.1186/1471-2164-7-35. BMC Genomics. 2006. PMID: 16504121 Free PMC article.
-
Best practices for hybridization design in two-colour microarray analysis.Trends Biotechnol. 2009 Jul;27(7):406-14. doi: 10.1016/j.tibtech.2009.03.007. Epub 2009 May 28. Trends Biotechnol. 2009. PMID: 19481825 Review.
-
Identification of differentially expressed genes and false discovery rate in microarray studies.Curr Opin Lipidol. 2007 Apr;18(2):187-93. doi: 10.1097/MOL.0b013e3280895d6f. Curr Opin Lipidol. 2007. PMID: 17353668 Review.
Cited by
-
Necrotrophism is a quorum-sensing-regulated lifestyle in Bacillus thuringiensis.PLoS Pathog. 2012;8(4):e1002629. doi: 10.1371/journal.ppat.1002629. Epub 2012 Apr 12. PLoS Pathog. 2012. PMID: 22511867 Free PMC article.
-
Global gene expression profile for swarming Bacillus cereus bacteria.Appl Environ Microbiol. 2011 Aug;77(15):5149-56. doi: 10.1128/AEM.00245-11. Epub 2011 Jun 3. Appl Environ Microbiol. 2011. PMID: 21642396 Free PMC article.
-
Platelet-activating factor induces proliferation in differentiated keratinocytes.Mol Cell Biochem. 2013 Dec;384(1-2):83-94. doi: 10.1007/s11010-013-1784-6. Epub 2013 Aug 24. Mol Cell Biochem. 2013. PMID: 23975504
References
Publication types
MeSH terms
Substances
LinkOut - more resources
Full Text Sources
