

Assisted Reproductive Technology affects developmental kinetics, H19 Imprinting Control Region methylation and H19 gene expression in individual mouse embryos
- PMID: 17949482
- PMCID: PMC2169233
- DOI: 10.1186/1471-213X-7-116
Assisted Reproductive Technology affects developmental kinetics, H19 Imprinting Control Region methylation and H19 gene expression in individual mouse embryos
Abstract
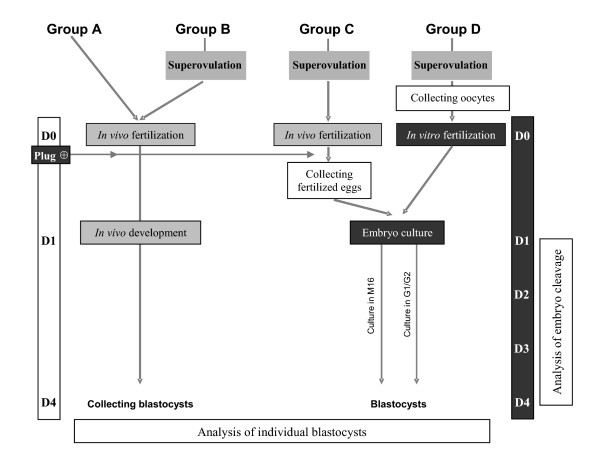
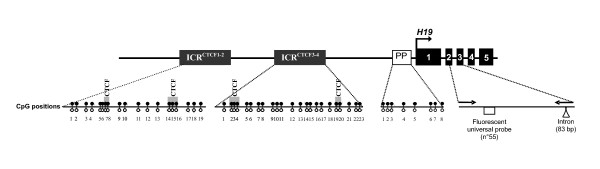
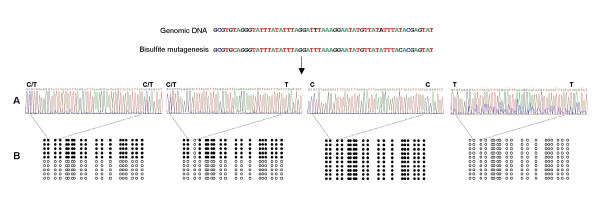
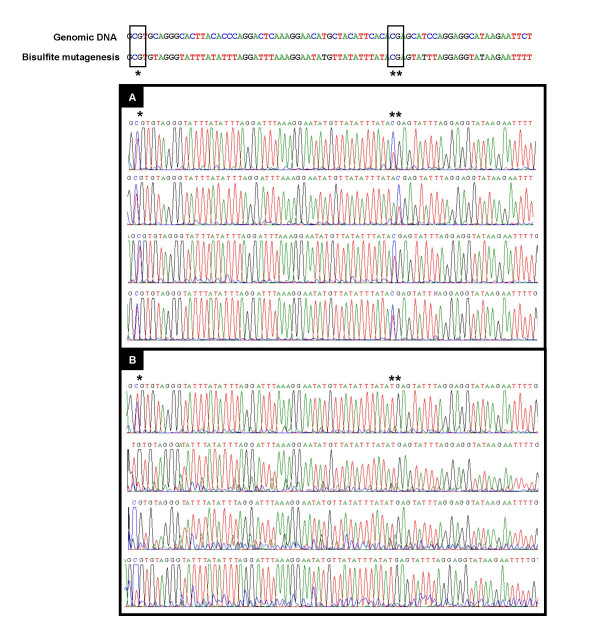
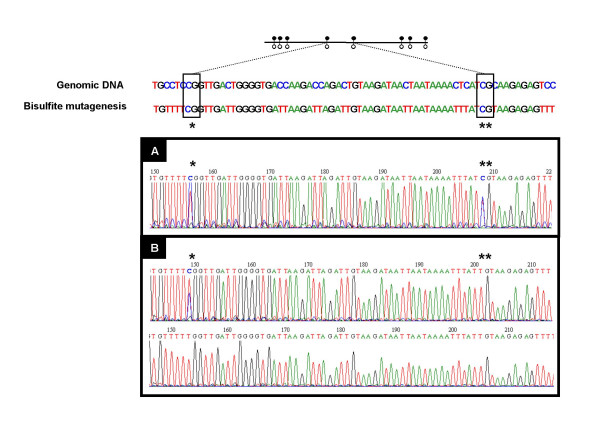
Background: In the last few years, an increase in imprinting anomalies has been reported in children born from Assisted Reproductive Technology (ART). Various clinical and experimental studies also suggest alterations of embryo development after ART. Therefore, there is a need for studying early epigenetic anomalies which could result from ART manipulations, especially on single embryos. In this study, we evaluated the impact of superovulation, in vitro fertilization (IVF) and embryo culture conditions on proper genomic imprinting and blastocyst development in single mouse embryos. In this study, different experimental groups were established to obtain embryos from superovulated and non-superovulated females, either from in vivo or in vitro fertilized oocytes, themselves grown in vitro or not. The embryos were cultured either in M16 medium or in G1.2/G2.2 sequential medium. The methylation status of H19 Imprinting Control Region (ICR) and H19 promoter was assessed, as well as the gene expression level of H19, in individual blastocysts. In parallel, we have evaluated embryo cleavage kinetics and recorded morphological data.
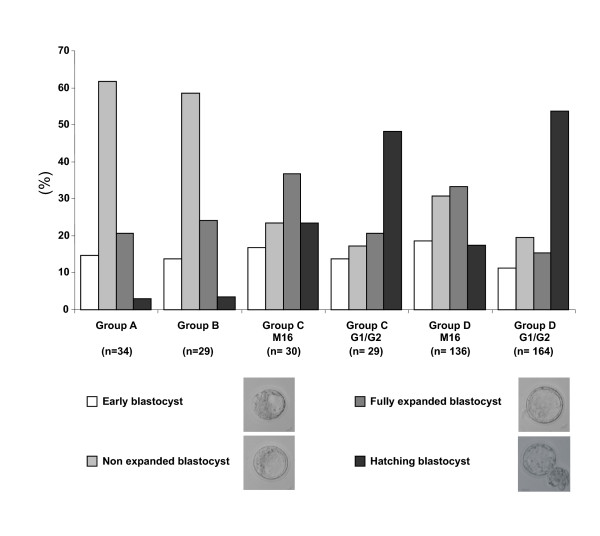
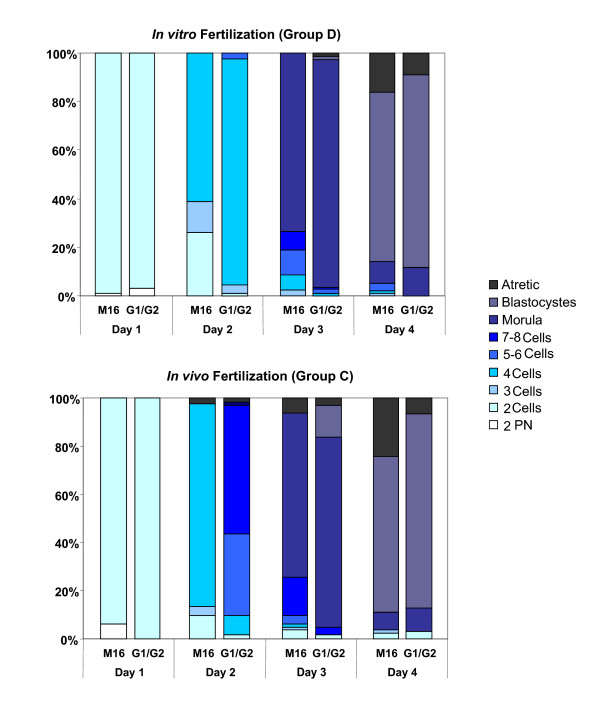
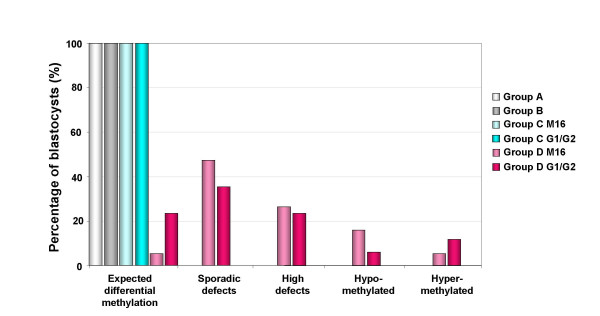
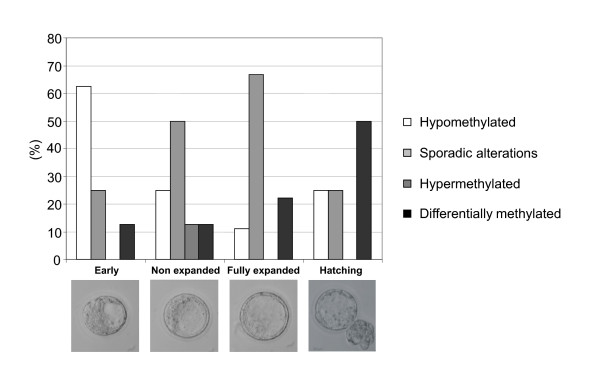
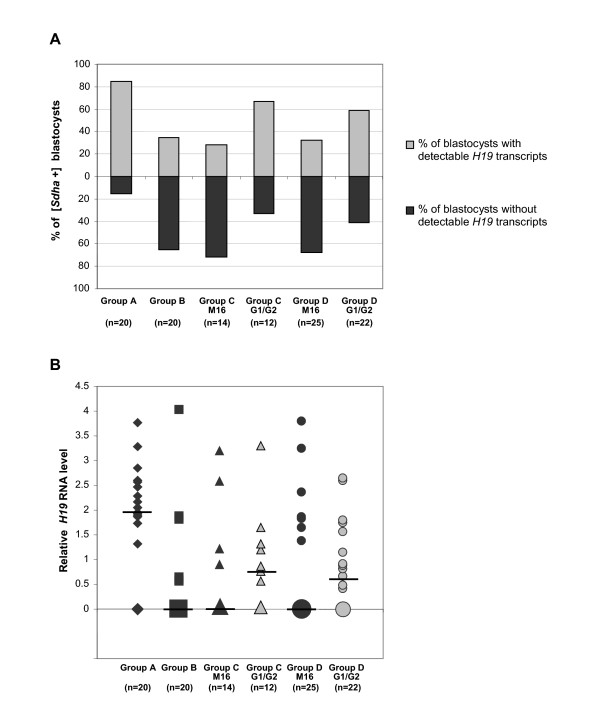
Results: We show that: 1. The culture medium influences early embryo development with faster cleavage kinetics for culture in G1.2/G2.2 medium compared to M16 medium. 2. Epigenetic alterations of the H19 ICR and H19 PP are influenced by the fertilization method since methylation anomalies were observed only in the in vitro fertilized subgroup, however to different degrees according to the culture medium. 3. Superovulation clearly disrupted H19 gene expression in individual blastocysts. Moreover, when embryos were cultured in vitro after either in vivo or in vitro fertilization, the percentage of blastocysts which expressed H19 was higher in G1.2/G2.2 medium compared to M16.
Conclusion: Compared to previous reports utilizing pools of embryos, our study enables us to emphasize a high individual variability of blastocysts in the H19 ICR and H19 promoter methylation and H19 gene expression, with a striking effect of each manipulation associated to ART practices. Our results suggest that H19 could be used as a sensor of the epigenetic disturbance of the utilized techniques.
Figures
Similar articles
-
The loss of imprinted DNA methylation in mouse blastocysts is inflicted to a similar extent by in vitro follicle culture and ovulation induction.Mol Hum Reprod. 2016 Jun;22(6):427-41. doi: 10.1093/molehr/gaw013. Epub 2016 Feb 7. Mol Hum Reprod. 2016. PMID: 26908643
-
Loss of methylation of H19-imprinted gene derived from assisted reproductive technologies can be mitigated by cleavage-stage embryo transfer in mice.J Assist Reprod Genet. 2019 Nov;36(11):2259-2269. doi: 10.1007/s10815-019-01575-x. Epub 2019 Sep 12. J Assist Reprod Genet. 2019. PMID: 31515683 Free PMC article.
-
IVF results in de novo DNA methylation and histone methylation at an Igf2-H19 imprinting epigenetic switch.Mol Hum Reprod. 2005 Sep;11(9):631-40. doi: 10.1093/molehr/gah230. Epub 2005 Oct 11. Mol Hum Reprod. 2005. PMID: 16219628
-
Modulating oxidative stress and epigenetic homeostasis in preimplantation IVF embryos.Zygote. 2022 Apr;30(2):149-158. doi: 10.1017/S0967199421000356. Epub 2021 Jul 27. Zygote. 2022. PMID: 34313209 Review.
-
DNA methylation profiles after ART during human lifespan: a systematic review and meta-analysis.Hum Reprod Update. 2022 Aug 25;28(5):629-655. doi: 10.1093/humupd/dmac010. Hum Reprod Update. 2022. PMID: 35259267
Cited by
-
DNA methylation status of imprinted H19 and KvDMR1 genes in human placentas after conception using assisted reproductive technology.Ann Transl Med. 2020 Jul;8(14):854. doi: 10.21037/atm-20-3364. Ann Transl Med. 2020. PMID: 32793698 Free PMC article.
-
Epigenetic disorders and altered gene expression after use of Assisted Reproductive Technologies in domestic cattle.Epigenetics. 2014 Jun;9(6):803-15. doi: 10.4161/epi.28711. Epub 2014 Apr 23. Epigenetics. 2014. PMID: 24709985 Free PMC article. Review.
-
A Review of Outcome Data concerning Children Born following Assisted Reproductive Technologies.ISRN Obstet Gynecol. 2012;2012:405382. doi: 10.5402/2012/405382. Epub 2012 Jun 17. ISRN Obstet Gynecol. 2012. PMID: 22778982 Free PMC article.
-
Epigenetic disruptions of histone signatures for the trophectoderm and inner cell mass in mouse parthenogenetic embryos.Stem Cells Dev. 2015 Mar 1;24(5):550-64. doi: 10.1089/scd.2014.0310. Epub 2014 Dec 2. Stem Cells Dev. 2015. PMID: 25315067 Free PMC article.
-
Alteration of Genomic Imprinting after Assisted Reproductive Technologies and Long-Term Health.Life (Basel). 2021 Jul 22;11(8):728. doi: 10.3390/life11080728. Life (Basel). 2021. PMID: 34440472 Free PMC article. Review.
References
-
- Barker DJ. The fetal and infant origins of disease. Eur J Clin Invest. 1995;25:457–463. - PubMed
Publication types
MeSH terms
Substances
LinkOut - more resources
Full Text Sources
Other Literature Sources
Miscellaneous
