. 2007 Dec 15;225(3):238-50.
doi: 10.1016/j.taap.2007.06.002. Epub 2007 Jun 19.

Exposure to inorganic mercury in vivo attenuates extrinsic apoptotic signaling in Staphylococcal aureus enterotoxin B stimulated T-cells

Affiliations

Exposure to inorganic mercury in vivo attenuates extrinsic apoptotic signaling in Staphylococcal aureus enterotoxin B stimulated T-cells

Michael D Laiosa et al. Toxicol Appl Pharmacol. .

Abstract

The heavy metal mercury (Hg) is known to have immunomodulatory properties affecting lymphocyte signal transduction, death receptor signaling and autoimmunity. In this study we tested the hypothesis that Hg exposure would attenuate T-cell activation and caspase 8 and 3 activity in response to antigenic stimuli. To test this hypothesis, BALB/cJ mice were exposed to 10 mg/l mercuric chloride (HgCl(2)) in their drinking water for 2 weeks followed by injection with 20 microg of the Staphylococcal aureus enterotoxin B (SEB) superantigen. Eighteen hours after SEB challenge, there was a statistically significant reduction in caspase 8 and caspase 3 enzyme activity in the SEB reactive Vbeta8+ T-cells. The attenuated caspase activity in Hg-exposed mice persisted for 48 h after exposure. Moreover, activation of caspase 8 and caspase 3 was reduced by more than 60% in CD95 deficient MRL/MpJ-Fas(lpr) mice demonstrating that caspase 8 and 3 activation in response to SEB is CD95 dependent. In addition to the effects of Hg on caspase activity, expression of the T-cell activation marker CD69 was also attenuated in SEB reactive Vbeta8 T-cells in Hg-exposed mice. Moreover, CD69 expression in MRL/MpJ-Fas(lpr) mice was also reduced. Taken together the caspase and CD69 data support a role for CD95 in promoting a proapoptotic and activated state in SEB responsive T-lymphocytes and this state is attenuated by the autoimmune potentiating environmental agent mercury.


Figures

Figure 1
Figure 1
Time course of Vβ8 T-cell expansion and deletion in response to SEB stimulation. BALB/cJ mice were first exposed to 10 mg/L HgCl2 in drinking water (filled in shapes) or pure drinking water alone (open shapes) for a period of two weeks. Subsequently, mice were injected iv with 20μg SEB in PBS by tail vein injection, and mice were euthanized at various time points after injection. The spleen and lymph nodes were removed, cell suspensions made and surface phenotype assessed by flow cytometry. The absolute cell numbers for T-cells bearing the Vβ8 T-cell antigen receptor (circles), or Vβ6 (triangles) are shown for both CD4 and CD8 populations in the lymph node and spleen. Data are expressed as the mean ± SEM pooled from three independent experiments with 5 mice per group in each experiment.
Figure 2
Figure 2
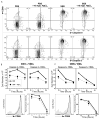
SEB selectively induces activation of caspase 8 and caspase 3 in Vβ8+ T-cells. Splenocytes from PBS or SEB challenged BALB/cJ mice and PBS or SEB challenged mice exposed to 10 mg/L HgCl2 were stained for CD4, CD8, Vβ8 TCR, Vβ6 TCR and incubated with a fluorogenic caspase 8 or caspase 3 substrate detectable by flow cytometry. Representative splenocyte samples are shown to demonstrate how data were analyzed and that there was no significant effect on T-cell distribution following exposure to either SEB, HgCl2 or both. Cells were first gated based on surface expression of either CD4 or CD8, followed by Vβ8 versus Vβ6 within each gate (CD4+ T-cells are shown in the second column). The percentage of cells with activated caspase 8 or caspase 3 is determined by calculating the maximal difference in fluorescence between Vβ8 T-cells and Vβ6 T-cells, using the Overton algorithm in the FlowJo analysis software. Shaded histograms represent fluorescence within CD4+Vβ6+ cells compared with solid lines indicating fluorescence of CD4+Vβ8+ T-cells. The number above the cursor represents the percentage of cells expressing caspase enzyme activity for each representative sample.
Figure 3
Figure 3
Hg intoxication attenuates activation of caspase 8 and 3 enzymes. The percentage of cells with active Caspase 8 (figure 3A) and caspase 3 (figure 3B) was monitored 12-48 hours after SEB exposure in CD4 and CD8 T-cells in the lymph node (top panels) and spleen (bottom panels). The percentage of cells with activated caspase enzymes were determined by flow cytometry as described in figure 2. Data are presented as the mean ± SEM and are representative of three independent experiments with 5 mice per group. An * denotes statistical significance between control (open circles) and Hg intoxicated mice (dark circles) with p≤0.01. Both caspase 8 and caspase 3 activity was always less than 5% in PBS challenged mice at all time points and thus are not shown on these graphs.
Figure 4
Figure 4
Hg intoxication attenuates SEB – induced T-cell activation. Eighteen hours after SEB exposure, splenocytes were removed, gated on CD4+Vβ8+ or CD8+Vβ8+ T-cells, and CD69 expression versus caspase 8 or caspase 3 activity was determined. In panel 4A, CD69+ caspase 8+ or caspase 3+ cells were considered activated T-cells with a pro-apoptotic phenotype and gates were established based on CD69 and caspase fluorescence in PBS challenged mice. The percentage of CD69+ caspase+ cells was used to calculate the absolute splenic number of these cells shown in panel B and C. In B, absolute cell number (x106) for CD4+ caspase 8 or CD4+ caspase 3 are shown with the mean ± SEM for 5 mice per group. Within CD4+Vβ8+ subset, CD69 expression was measured. The dark line represents SEB – exposed control mice, and the shaded histogram represents the SEB – exposed Hg group. MFI of CD69 in each group over time is shown next to the CD69 histogram with open circles representing controls and filled in circles representing Hg – exposed mice. In C, data for the CD8+ splenic T-cells is shown. An * denotes statistical significance with p≤0.01.
Figure 5
Figure 5
A genetic defect in CD95 attenuates SEB – induced activation of caspase 8 and caspase 3. MRL/MpJ or MRL/MpJ-Faslpr mice were injected with PBS or SEB and lymph nodes and spleens removed 18 hours later. CD4 versus CD8 profiles for splenocytes are shown 18 hours after SEB. Within the CD4 T-cell population the distribution of T-cells bearing either Vβ8+ or Vβ6+ T-cells is shown. Cells were first gated based on surface expression of either CD4 or CD8, followed by Vβ8 versus Vβ6 within each gate (CD4+ T-cells are shown in the second column). The percentage of cells with activated caspase 8 or caspase 3 is determined by calculating the maximal difference in fluorescence between Vβ8 T-cells and Vβ6 T-cells, using the Overton algorithm in the FlowJo analysis software. Shaded histograms represent fluorescence within CD4+Vβ6+ cells compared with solid lines indicating fluorescence of CD4+Vβ8 T-cells. The number above the cursor represents the percentage of cells expressing caspase enzyme activity for each representative sample.
Figure 6
Figure 6
CD95 deficient mice fail to activate caspase 8 and caspase 3 enzyme activity upon SEB challenge. MRL/MpJ or MRL/MpJ-Faslpr mice were injected with PBS or SEB and lymph nodes and spleens removed 18, 24, or 48 hours later and caspase activity determined as shown in figure 5. In A, Caspase 8 activity is shown for CD4 and CD8 lymphocytes and splenocytes. Open triangles identify data from the MRL/MpJ and filled triangles identify the MRL/MpJ-Faslpr. In B, caspase 3 activity is shown. Data are presented as the mean ± SEM with 3 mice per group. An * indicates data are statistically significant with p≤0.01.
Figure 7
Figure 7
CD95 is required for promoting the activated pro-apoptotic state of Vβ8 T-cells in response to SEB. A. Representative flow cytometry plots show CD69 versus caspase 8 (left four panels) or caspase 3 (right four panels row) in CD4+ MRL/MpJ or MRL/MpJ-Faslpr splenocytes in response to PBS (top panels) or SEB (bottom panels) 18 hours later. B. Higher background levels of caspase activity in CD4+ T-cells do not account for decreased caspase activity observed in MRL/MpJ-Faslpr. In the top histogram, the percentage of cells with activated caspase 8 was measured by comparing CD4+Vβ8+ T-cells from PBS (shaded histogram) and SEB treated MRL/MpJ-Faslpr mice (solid line). In the bottom histogram, the percentage of cells with activated caspase 8 was compared in CD4+Vβ8+ T-cells from MRL/MpJ mice (solid line) and MRL/MpJ-Faslpr mice exposed to SEB (shaded histogram).

References

    1. Adachi M, Suematsu S, Kondo T, Ogasawara J, Tanaka T, Yoshida N, Nagata S. Targeted mutation in the Fas gene causes hyperplasia in peripheral lymphoid organs and liver. Nat Genet. 1995;11:294–300. - PubMed
    1. Adachi M, Suematsu S, Suda T, Watanabe D, Fukuyama H, Ogasawara J, Tanaka T, Yoshida N, Nagata S. Enhanced and accelerated lymphoproliferation in Fas-null mice. Proc Natl Acad Sci U S A. 1996;93:2131–2136. - PMC - PubMed
    1. Adachi M, Watanabe-Fukunaga R, Nagata S. Aberrant transcription caused by the insertion of an early transposable element in an intron of the Fas antigen gene of lpr mice. Proc Natl Acad Sci U S A. 1993;90:1756–1760. - PMC - PubMed
    1. Altman A. Abnormal antigen receptor-initiated signal transduction in lpr T lymphocytes. Semin Immunol. 1994;6:9–17. - PubMed
    1. Bagenstose LM, Salgame P, Monestier M. Murine mercury-induced autoimmunity: a model of chemically related autoimmunity in humans. Immunol Res. 1999;20:67–78. - PubMed

Publication types

MeSH terms