

Discrimination of Bacillus anthracis and closely related microorganisms by analysis of 16S and 23S rRNA with oligonucleotide microarray
- PMID: 17950718
- PMCID: PMC3188417
- DOI: 10.1016/j.cbi.2007.09.002
Discrimination of Bacillus anthracis and closely related microorganisms by analysis of 16S and 23S rRNA with oligonucleotide microarray
Abstract
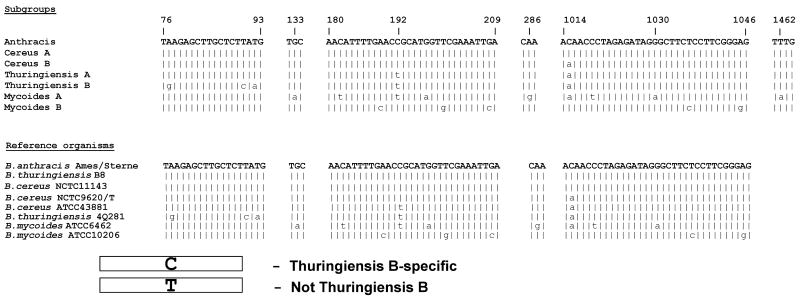
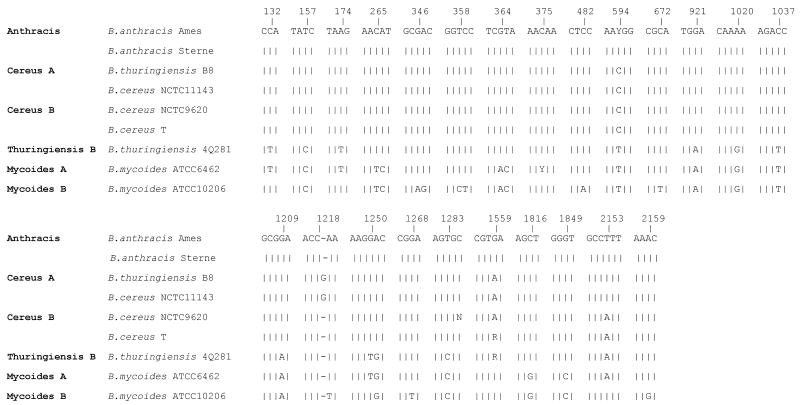
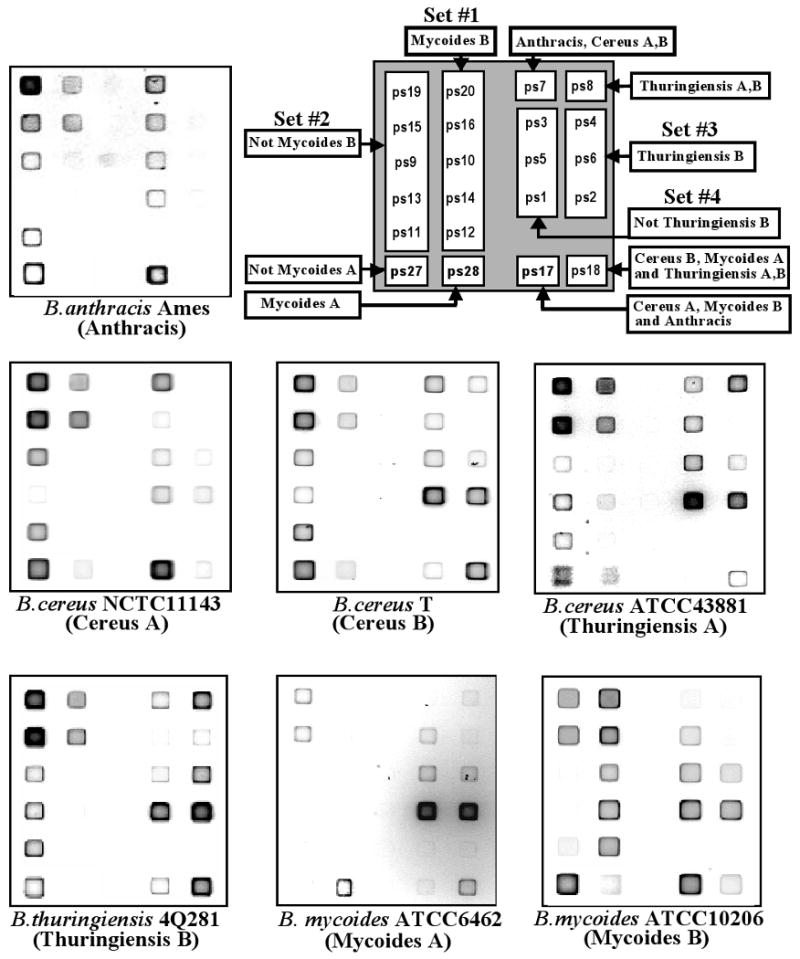
Analysis of 16S rRNA sequences is a commonly used method for the identification and discrimination of microorganisms. However, the high similarity of 16S and 23S rRNA sequences of Bacillus cereus group organisms (up to 99-100%) and repeatedly failed attempts to develop molecular typing systems that would use DNA sequences to discriminate between species within this group have resulted in several suggestions to consider B. cereus and B. thuringiensis, or these two species together with B. anthracis, as one species. Recently, we divided the B. cereus group into seven subgroups, Anthracis, Cereus A and B, Thuringiensis A and B, and Mycoides A and B, based on 16S rRNA, 23S rRNA and gyrB gene sequences and identified subgroup-specific makers in each of these three genes. Here we for the first time demonstrated discrimination of these seven subgroups, including subgroup Anthracis, with a 3D gel element microarray of oligonucleotide probes targeting 16S and 23S rRNA markers. This is the first microarray enabled identification of B. anthracis and discrimination of these seven subgroups in pure cell cultures and in environmental samples using rRNA sequences. The microarray bearing perfect match/mismatch (p/mm) probe pairs was specific enough to discriminate single nucleotide polymorphisms (SNPs) and was able to identify targeted organisms in 5min. We also demonstrated the ability of the microarray to determine subgroup affiliations for B. cereus group isolates without rRNA sequencing. Correlation of these seven subgroups with groupings based on multilocus sequence typing (MLST), fluorescent amplified fragment length polymorphism analysis (AFLP) and multilocus enzyme electrophoresis (MME) analysis of a wide spectrum of different genes, and the demonstration of subgroup-specific differences in toxin profiles, psychrotolerance, and the ability to harbor some plasmids, suggest that these seven subgroups are not based solely on neutral genomic polymorphisms, but instead reflect differences in both the genotypes and phenotypes of the B. cereus group organisms.
Figures
Similar articles
-
Use of 16S rRNA, 23S rRNA, and gyrB gene sequence analysis to determine phylogenetic relationships of Bacillus cereus group microorganisms.J Clin Microbiol. 2004 Aug;42(8):3711-30. doi: 10.1128/JCM.42.8.3711-3730.2004. J Clin Microbiol. 2004. PMID: 15297521 Free PMC article.
-
Strategy for identification of Bacillus cereus and Bacillus thuringiensis strains closely related to Bacillus anthracis.Appl Environ Microbiol. 2006 Feb;72(2):1295-301. doi: 10.1128/AEM.72.2.1295-1301.2006. Appl Environ Microbiol. 2006. PMID: 16461679 Free PMC article.
-
Comparative analysis of the 16S to 23S ribosomal intergenic spacer sequences of Bacillus thuringiensis strains and subspecies and of closely related species.Appl Environ Microbiol. 1995 Apr;61(4):1623-6. doi: 10.1128/aem.61.4.1623-1626.1995. Appl Environ Microbiol. 1995. PMID: 7538281 Free PMC article.
-
Comparative analysis of 23S ribosomal RNA gene sequences of Bacillus anthracis and emetic Bacillus cereus determined by PCR-direct sequencing.FEMS Microbiol Lett. 1992 Jul 1;73(1-2):75-80. doi: 10.1016/0378-1097(92)90586-d. FEMS Microbiol Lett. 1992. PMID: 1381695
-
Fluorescent heteroduplex assay for monitoring Bacillus anthracis and close relatives in environmental samples.Appl Environ Microbiol. 2003 Jun;69(6):3317-26. doi: 10.1128/AEM.69.6.3317-3326.2003. Appl Environ Microbiol. 2003. PMID: 12788732 Free PMC article.
Cited by
-
In Silico Genomic Fingerprints of the Bacillus anthracis Group Obtained by Virtual Hybridization.Microarrays (Basel). 2015 Feb 17;4(1):84-97. doi: 10.3390/microarrays4010084. Microarrays (Basel). 2015. PMID: 27600214 Free PMC article.
References
-
- Sneath PHA. Endospore-forming Gram-positive rods and cocci. In: Holt JG, editor. Bergey's Manual of Systematic Bacteriology. The Williams & Wilkins Co.; Baltimore, MD: 1986. pp. 1104–1139.
-
- Turnbull PCB. Definitive identification of Bacillus anthracis — a review. J Appl Microbiol. 1999;87:237–240. - PubMed
-
- Lechner S, Mayr R, Fransis KP, Pruss BM, Kaplan T, Wiebner-Gunkel E, Stewart GS, Scherer AB. Bacillus weihenstephanensis sp. nov. is a new psychrotolerant species of the Bacillus cereus group. Int J Syst Bacteriol. 1998;48:1373–1382. - PubMed
-
- Nakamura LK. Bacillus pseudomycoides sp. nov. Int Syst Bacteriol. 1998;48:1031–1034. - PubMed
Publication types
MeSH terms
Substances
Grants and funding
LinkOut - more resources
Full Text Sources
Other Literature Sources
Molecular Biology Databases
Miscellaneous
