. 2008 Feb;57(2):232-42.
doi: 10.1136/gut.2006.119180. Epub 2007 Oct 19.

Pathophysiology and fate of hepatocytes in a mouse model of mitochondrial hepatopathies

Affiliations

Pathophysiology and fate of hepatocytes in a mouse model of mitochondrial hepatopathies

F Diaz et al. Gut. 2008 Feb.

Abstract

Background: Although oxidative phosphorylation defects can affect the liver, these conditions are poorly understood, partially because of the lack of animal models.

Aims: To create and characterise the pathophysiology of mitochondrial hepatopathies in a mouse model.

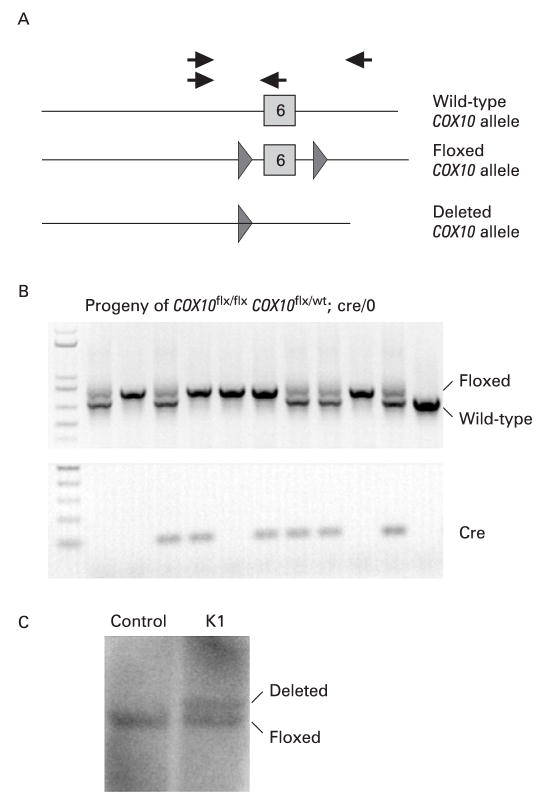
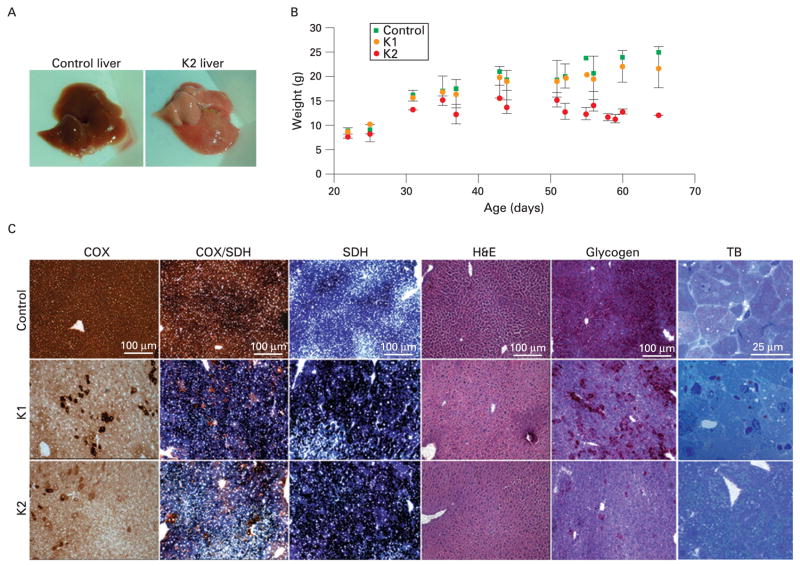
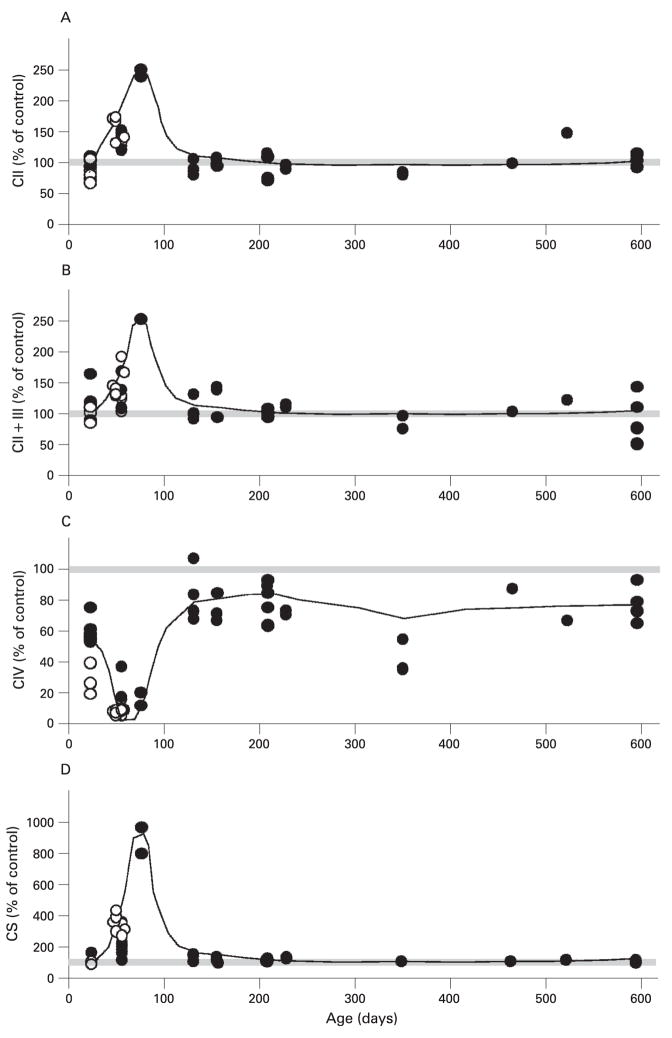
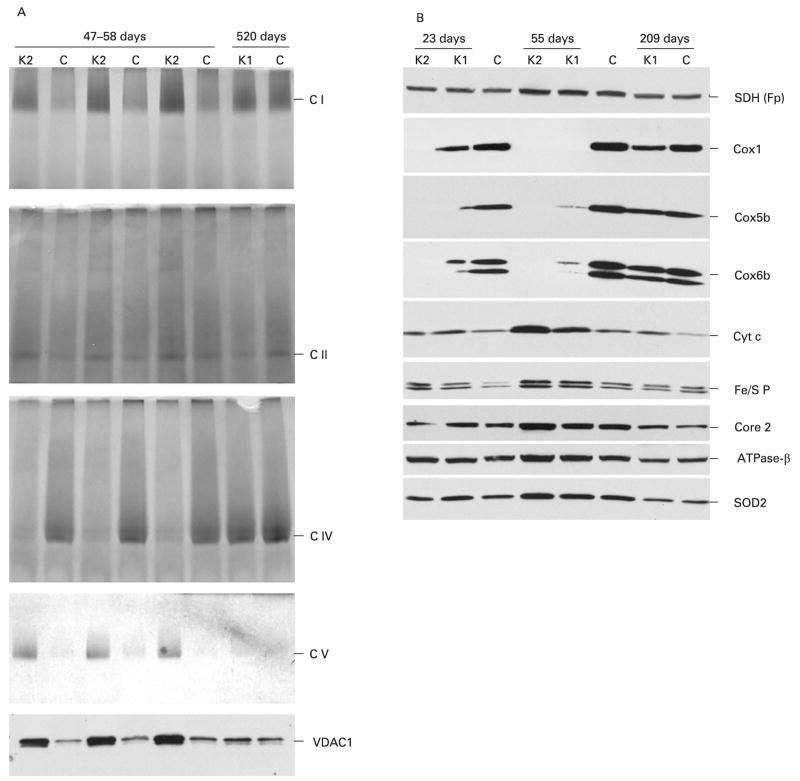
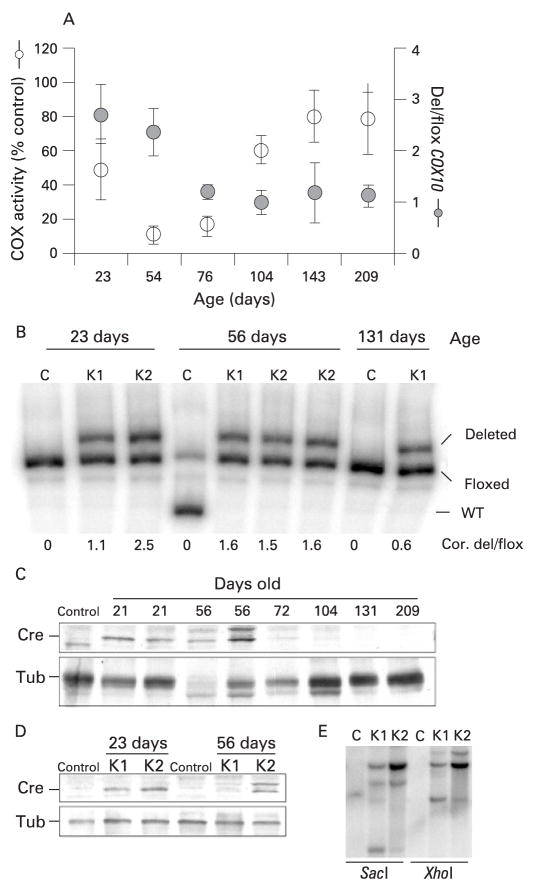
Methods: A mouse model of mitochondrial hepatopathies was created by the conditional liver knockout (KO) of the COX10 gene, which is required for cytochrome c oxidase (COX) function. The onset and progression of biochemical, molecular and clinical phenotypes were analysed in several groups of animals, mostly at postnatal days 23, 56, 78 and 155.

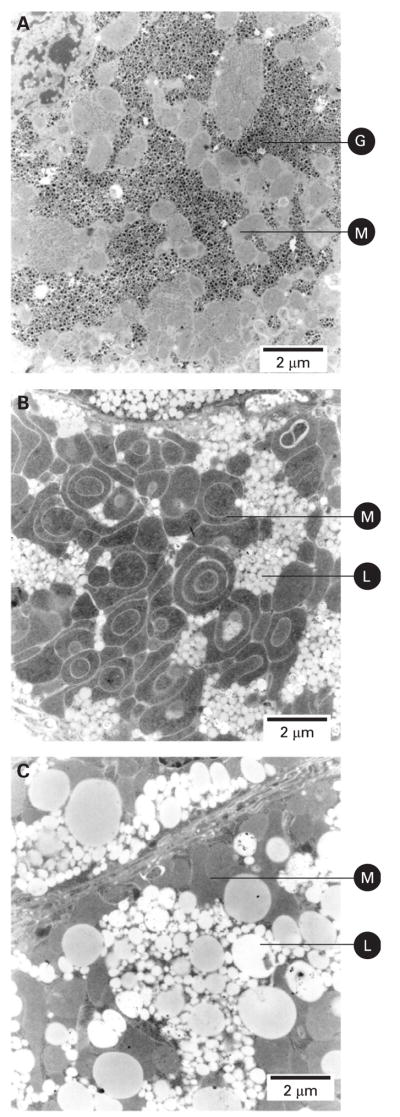
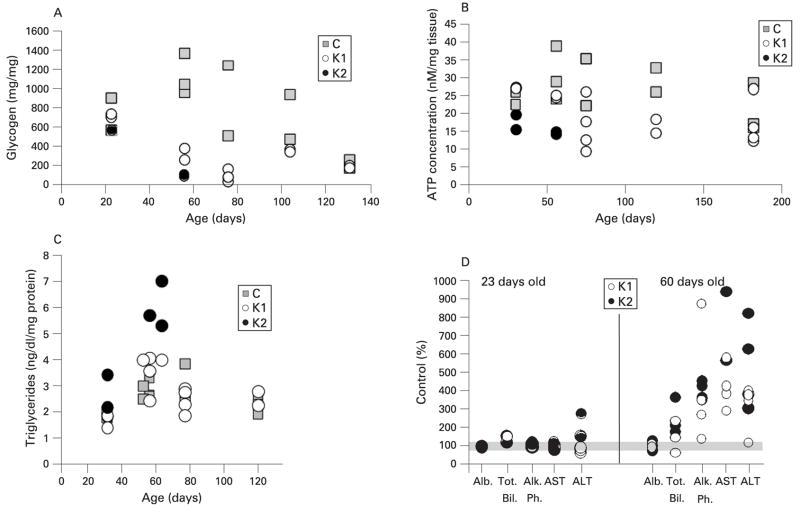
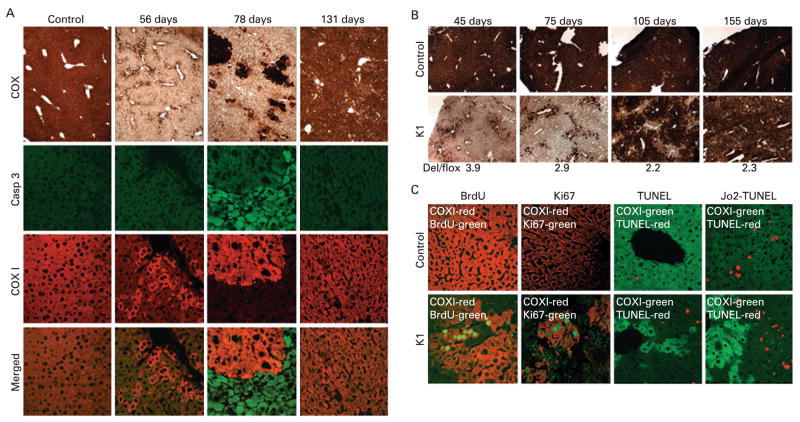
Results: Biochemical and histochemical analysis of liver samples from 23-56-day-old KO mice showed liver dysfunction, a severe COX deficiency, marked mitochondrial proliferation and lipid accumulation. Despite these defects, the COX-deficient hepatocytes were not immediately eliminated, and apoptosis followed by liver regeneration could be observed only at age 78 days. Hepatocytes from 56-78-day-old KO mice survived despite very low COX activity but showed a progressive depletion of glycogen stores. In most animals, hepatocytes that escaped COX10 ablation were able to proliferate and completely regenerate the liver between days 78 and 155.

Conclusions: The results showed that when faced with a severe oxidative phosphorylation defect, hepatocytes in vivo can rely on glycolysis/glycogenolysis for their bioenergetic needs for relatively long periods. Ultimately, defective hepatocytes undergo apoptosis and are replaced by COX-positive cells first observed in the perivascular regions.


Figures

Figure 1
Figure 1
Creation of a liver-specific COX10 knockout (KO) mouse. We introduced loxP sites flanking exon 6 of the COX10 gene to produce conditional KO mice.8(A) Diagram of the COX10 gene showing the exon 6 wild-type allele, the floxed COX10 allele (triangles represent the loxP sites flanking the exon) and the deleted COX10 allele resulting from Cre recombination. To obtain the liver-specific COX10 KO mouse, we crossed a mouse homozygous for the floxed allele with a heterozygous mouse for the floxed allele carrying the Cre recombinase transgene under the albumin promoter. (B) The progeny were genotyped by PCR using the set of primers indicated with black arrows in (A) and with specific primers to detect the presence of Cre. The COX10 KO mice are homozygous for the floxed gene and contain the Cre transgene (lanes 4 and 6). (C) Southern blot of control and K1 liver DNA digested with BamHI showing the presence of the deletion and floxed alleles using a genomic probe for the COX10 gene.
Figure 2
Figure 2
Liver COX10 knockout (KO) phenotype. We obtained COX10 KO mice heterozygous (K1) or homozygous (K2) for the Cre transgene. K1 mice looked healthy and had a normal life span while K2 mice died at about 45–65 days of age (A) Gross phenotype of liver steatosis or “fatty liver” (pale coloration) of a 56-day-old K2 mouse compared with control. (B) Weight curves of K1 (orange circles) and K2 (red circles) mice compared with control (green squares) at different ages. Values are represented by the mean and standard deviation. (C) Histochemical analysis of control and COX10 KO mice at 56 days of age. Frozen liver sections were stained for cytochrome c oxidase (COX), COX/succinate dehydrogenase (SDH), SDH, H&E, glycogen (periodic acid–Schiff staining) and toluidine blue (TB). Scale bar for all staining is 100 μm, except for toluidine blue (25 μm).
Figure 3
Figure 3
Mitochondrial proliferation and accumulation of lipid droplets in liver of COX10 knockout mice. Electron micrographs of liver sections of 60-day-old animals. (A) Liver of a control mouse showing cytoplasmic glycogen granules and normal mitochondria. (B) Liver of a COX10 K1 mouse showing an increased number of mitochondria and accumulation of small lipid droplets. (C) Liver of a COX10 K2 mouse showing larger lipid droplets and absence of cytoplasmic glycogen granules. Images were obtained at 8900×magnification. G, glycogen granules; M, mitochondria; L, lipid droplets. Scale bar: 2 μm.
Figure 4
Figure 4
Glycogen depletion, ATP decrease, elevation of triglycerides and liver injury in COX10 knockout (KO) mice returned to normal levels with age. (A) Glycogen content was determined in liver samples (50–100 mg tissue) of COX10 KO mice (K1 and K2) at different ages. Values are expressed as a percentage of those of control littermates. (B) ATP concentration in liver extracts of control, K1 and K2 mice at different ages was determined using a luciferase assay. Values were normalised to mg of tissue used for the extraction. (C) Triglyceride levels were measured in liver homogenates and normalised to mg of protein. (D) Levels of different liver markers: albumin (Alb), total bilirubin (Tot. Bil.), alkaline phosphatase (Alk Ph.), aspartate aminotransferase (AST) and alanine aminotransferase (ALT) in blood serum were expressed as a percentage of control values. The grey bar indicates 100%. The symbols in all the graphs represent one mouse. Control mice are represented by grey squares, K1 by open circles, and K2 by filled circles.
Figure 5
Figure 5
Enzyme activities of respiratory complexes of control and COX10 knockout (KO) mice. Enzyme activities were determined spectrophotometrically in isolated liver mitochondria of KO mice as described in the Materials and methods section. (A) Succinate decylubiquinone DCPIP reductase or complex II activity. (B) Succinate cytochrome c reductase or complex II + III activity. (C) Cytochrome c oxidase or complex IV activity. (D) Citrate synthase activity. The enzymatic activities are expressed as a percentage of mean values obtained from control animals on the same day (control n = 35 and K1+K2 n = 52). Each symbol represents one mouse; filled circles are K1 mice and open circles are K2 mice. The trend in enzyme activity changes at different ages is represented with a line in the graphs and 100% is depicted with a grey bar.
Figure 6
Figure 6
Steady-state levels of respiratory complexes in control and COX10 knockout mice changed with age. Oxidative phosphorylation complexes were separated from isolated mitochondria (20 μg) by 4–13% gradient blue native electrophoresis. (A) In-gel activity stain of the blue native gels for complexes I, II, IV and V, respectively. The voltage-dependent anion channel (VDAC1) western blot was used as a loading control for the blue native gels. (B) Steady-state levels of different subunits of the respiratory complexes of control, K1 and K2 mice at different ages. Mitochondrial proteins (25 μ) were separated by SDS–polyacrylamide gel electrophoresis, transferred to a polyvinylidene difluoride membrane and blotted with antibodies against several subunits of complex IV (Cox1, Cox5b, Cox6b), cytochrome c, complex III (iron–sulphur protein (Fe/S P) and core 2), complex V (ATPase-β) and Mn-superoxide dismutase 2 (SOD2).
Figure 7
Figure 7
Caspase-3 (Casp 3) activation and regeneration in hepatocytes from COX10 knockout mice. Frozen liver sections (6–8 μm) were obtained from control and K1 mice at different ages and (A) stained for cytochrome c oxidase (COX) activity or immunostained with antibodies against the active form of caspase-3 (green label) or Cox1p (red label). Cox1p is used as a marker for COX10 deletion and COX activity. (B) Small liver biopsies (about 5 mm2) obtained from the same control and K1 mice at different times and stained for COX activity (figure shows a representative example n = 6 for each group). The figure shows the severe COX deficiency obtained at an early age, and as age progressed the liver regenerated with COX-positive hepatocytes. The amount of COX10 deletion (Del/flox) in the K1 mouse at the different time points was determined as described in the Materials and methods section and indicated at the bottom of the figure. (C) The two left-hand panels show proliferation of COX-positive hepatocytes by bromodeoxyuridine (BrdU) incorporation and expression of nuclear antigen Ki67 by immunostaining (green label) and Cox1p (red label) in 78-day-old control and K1 mice. The two right-hand panels show basal and induced (Jo2 injection) levels of apoptotis assessed by terminal deoxynucleotidyl transferase end labelling (TUNEL) assay in 60-day-old control and K1 mice. TUNEL stain is labelled in red and Cox1p in green.
Figure 8
Figure 8
Changes of COX10 deletion and Cre expression with age in COX10 knockout (KO) mice. The amount of COX10 deletion was calculated by the last cycle hot multiplex PCR using the set of primers depicted in fig 1A. We constructed a standard curve to correct the values for preferential amplification (described in the Materials and methods section). (A) Correlation of the amount of COX10 deletion (expressed as a ratio of deleted to floxed allele; Del/flox) and cytochrome c oxidase (COX) activity of K1 mice at different ages. Values in the graph are the corrected values using the standard curve represented as mean and standard deviation. (B) Last cycle hot multiplex PCR showing amplification of the deletion, floxed and wild-type COX10 alleles separated in a 5% acrylamide gel. Numbers below the figure correspond to the corrected values of COX10 deletion expressed as the ratio of the deleted/floxed amplicon (Cor. del/flox). The 56 day control mouse is heterozygous, containing the floxed and wild-type COX10 alleles. (C) Steady-state levels of Cre recombinase in control and KO mice at different ages. Liver nuclear extracts of control, K1 and K2 mice were western blotted with anti-Cre polyclonal antibody and with an anti-tubulin monoclonal antibody for loading control. (D) Steady-state levels of Cre in K1 and K2 mice at 23 and 56 days of age using tubulin (Tub) as a protein loading control. (E) Southern blot of Cre recombinase in K1 and K2 mice. Liver DNA was digested with SacI or XhoI, separated in an agarose gel, transferred to a Z-probe membrane and hybridised with a Cre-specific probe. K1 mice are hemizygous and K2 mice are homozygous Cre as shown by western and Southern blot.

References

    1. Chinnery PF, DiMauro S. Mitochondrial hepatopathies. J Hepatol. 2005;43:207–9. - PubMed
    1. Bandyopadhyay SK, Dutta A. Mitochondrial hepatopathies. J Assoc Physicians India. 2005;53:973–8. - PubMed
    1. Sokol RJ, Treem WR. Mitochondria and childhood liver diseases. J Pediatr Gastroenterol Nutr. 1999;28:4–16. - PubMed
    1. Anderson S, Bankier AT, Barrell BG, et al. Sequence and organization of the human mitochondrial genome. Nature. 1981;290:457–65. - PubMed
    1. Tsukihara T, Aoyama H, Yamashita E, et al. The whole structure of the 13-subunit oxidized cytochrome c oxidase at 2.8 Å. Science. 1996;272:1136–44. - PubMed

Publication types

MeSH terms

Substances