. 2007 Oct 30;104(44):17317-22.
doi: 10.1073/pnas.0704751104. Epub 2007 Oct 19.

GTPase acceleration as the rate-limiting step in Arabidopsis G protein-coupled sugar signaling

Affiliations

GTPase acceleration as the rate-limiting step in Arabidopsis G protein-coupled sugar signaling

Christopher A Johnston et al. Proc Natl Acad Sci U S A. .

Abstract

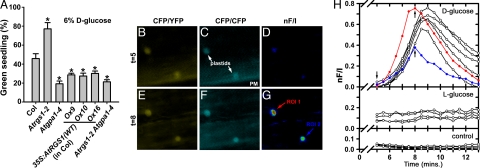
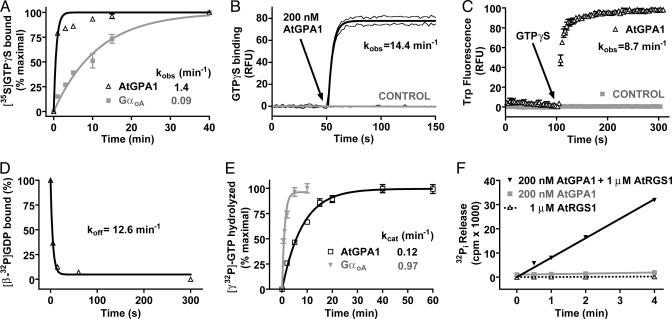
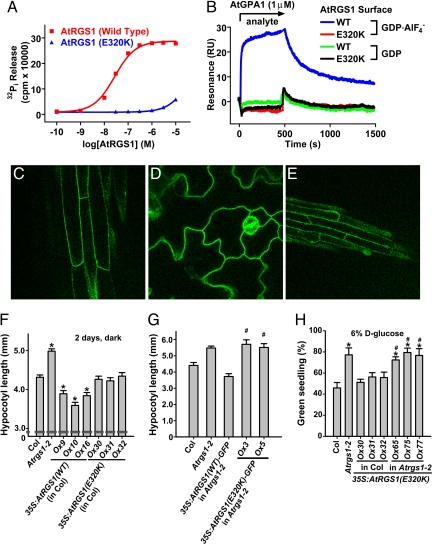
Heterotrimeric G protein signaling is important for cell-proliferative and glucose-sensing signal transduction pathways in the model plant organism Arabidopsis thaliana. AtRGS1 is a seven-transmembrane, RGS domain-containing protein that is a putative membrane receptor for d-glucose. Here we show, by using FRET, that d-glucose alters the interaction between the AtGPA1 and AtRGS1 in vivo. AtGPA1 is a unique heterotrimeric G protein alpha subunit that is constitutively GTP-bound given its high spontaneous nucleotide exchange coupled with slow GTP hydrolysis. Analysis of a point mutation in AtRGS1 that abrogates GTPase-accelerating activity demonstrates that the regulation of AtGPA1 GTP hydrolysis mediates sugar signal transduction during Arabidopsis development, in contrast to animals where nucleotide exchange is the limiting step in the heterotrimeric G protein nucleotide cycle.


Conflict of interest statement

The authors declare no conflict of interest.

Figures

Fig. 1.
Fig. 1.
Signal transduction by d-glucose is mediated by AtRGS1 and AtGPA1. (A) Seedlings of different genotypes were grown on 6% d-glucose, and the percentage of seedlings with green cotyledons was quantified. All genotypes had 100% green seedlings when grown on 1% d-glucose. Genotypes: Col, wild-type Columbia ecotype; Atrgs1–2, Atrgs1-null mutant; Atgpa1–4, Atgpa1-null mutant; 35S:AtRGS1(wild type: Ox9, Ox10, Ox16), three independent wild-type AtRGS1 constitutive overexpression lines; Atrgs1–2 Atgpa1–4, double-null mutant. Statistical significance was determined by Dunnett's test (*, P < 0.05 vs. Col). (B–G) d-glucose-induced FRET between AtRGS1-YFP and AtGPA1-CFP in Arabidopsis roots was measured in vivo. Fluorescence emission for CFP excitation/YFP emission (B and E) and CFP excitation/CFP emission (C and F) were captured 5 min (B and C) and 8 min (E and F) after the addition of d-glucose. The normalized net FRET (nF/I) at 5 min (D) and 8 min (G) after d-glucose addition is shown. PM, plasma membrane. (H) Levels of nF/I were calculated every 30 s from 5 to 30 min after addition of 6% (wt/vol) d-glucose, 6% (wt/vol) l-glucose, or no treatment controls. Red and blue lines show the observed FRET for the regions of interest (ROI) 1 and ROI 2, denoted in G. Black lines indicate other independent FRET efficiency measurements. Arrows indicate image capture time points of t = 5 and t = 8 min, as denoted in B–G.
Fig. 2.
Fig. 2.
Biochemical properties of AtGPA1. (A) Time course of [35S]GTPγS binding to 100 nM AtGPA1 or GαOA at 20°C. Data are the mean ± SEM of duplicate samples. Observed association rate constants (kobs) were: AtGPA1 1.44 [95% confidence interval (C.I.), 0.89–2.0] min−1 and GαOA 0.088 (95% C.I., 0.076–0.1) min−1. (B) Time course of BODIPYFL-GTPγS binding to 200 nM AtGPA1 at 20°C. Data are plotted as the mean ± SEM of three experiments. kobs = 14.4 (95% C.I., 12.5–16.2) min−1. RFU, relative fluorescence units. (C) The tryptophan fluorescence of 100 nM AtGPA1 or buffer alone (control) was measured at 20°C. At 100 s, GTPγS was added to a final concentration of 1 μM (arrow). Data are presented as the mean ± SEM of duplicates. kobs = 8.7 min−1 (SEM ± 1.5 min−1; n = 3). (D) Time course of [β-32P]GDP dissociation from AtGPA1 at 20°C. Data are the mean ± SEM of duplicates. Observed dissociation rate constant (koff) was 12.6 (95% C.I., 4.4–21.0) min−1. (E) Time course of single turnover [γ-32P]GTP hydrolysis by 200 nM AtGPA1 or GαOA at 20°C. Data are the mean ± SEM of duplicates. Rate constants for GTP hydrolysis (kcat) were: AtGPA1 0.12 (95% C.I., 0.11–0.13) min−1 and GαOA 0.97 (95% C.I., 0.70–1.4) min−1. (F) Time course of steady-state [γ-32P]GTP hydrolysis by 200 nM AtGPA1 in the presence or absence of 1 μM AtRGS1 at 20°C. Results are the mean ± SEM of duplicate samples. Rates of Pi production were AtGPA1 2.3 (95% C.I., 2.0–2.5) × 102 cpm/min, AtGPA1+AtRGS1 8.1 (95% C.I., 7.6–8.5) × 103 cpm/min, and AtRGS1 alone 6.9 (95% C.I., 4.0–9.8) × 10 cpm/min.
Fig. 3.
Fig. 3.
In vitro and in vivo characterization of AtRGS1(E320K) as a GAP-dead mutant. (A) Dose–response analysis of AtGPA1 steady-state GTPase acceleration by wild type (WT) and E320K AtRGS1. GTPase assays were conducted for 20 min with 200 nM AtGPA1, and EC50 values were determined by regression for WT as 2.7 (95% C.I., 2.4–3.1) × 10−8 M and for the E320K mutant as 4.5 (95% C.I., 4.3–4.7) × 10−5 M. For these EC50 regression analyses, it was assumed that the E320K mutant has the same efficacy as WT protein. (B) Surface plasmon resonance was used to measure the interaction between AtRGS1 and AtGPA1. WT or E320K GST-AtRGS1 was immobilized on a biosensor surface. Then 1 μM AtGPA1 in the GDP or GDP-AlF4-bound form was injected over the biosensor surface. Nonspecific binding to GST was subtracted from all curves. (C–E) AtRGS1(E320K)-GFP localization was visualized in Arabidopsis hypocotyls (C), cotelydons (D), and roots (E) by using epifluorescence microscopy. (F) Hypocotoyl lengths of 2-day-old, dark-grown seedlings were measured. Genotypes: 35S:AtRGS1(WT or E320K) (wild-type or E320K AtRGS1 constitutive overexpression lines). Multiple independent overexpression lines were generated and analyzed; individual lines are denoted Ox. Statistical significance was determined by Bonferroni's test (*, P < 0.05 vs. Col). (G) Experiments were performed as in F, but Arabidopsis-expressing AtRGS1-GFP-fusion proteins were used. Statistical significance was determined by Bonferroni's test (*, P < 0.05 vs. Col; #, P > 0.05 vs. Atrgs1–2). (H) Seedlings of the indicated genotypes were grown on 6% glucose, and the percentage of seedlings with green cotyledons was quantified. All genotypes had 100% green seedlings when grown on 1% glucose. Genotypes are described in F. Statistical significance was determined by Bonferroni's test (*, P < 0.05 vs. Col; #, P > 0.05 vs. Atrgs1–2).

References

    1. Birnbaumer L. Annu Rev Pharmacol Toxicol. 1990;30:675–705. - PubMed
    1. Pierce KL, Premont RT, Lefkowitz RJ. Nat Rev Mol Cell Biol. 2002;3:639–650. - PubMed
    1. McCudden CR, Hains MD, Kimple RJ, Siderovski DP, Willard FS. Cell Mol Life Sci. 2005;62:551–577. - PMC - PubMed
    1. Chen JG, Jones AM. Methods Enzymol. 2004;389:338–350. - PubMed
    1. Chen JG, Willard FS, Huang J, Liang J, Chasse SA, Jones AM, Siderovski DP. Science. 2003;301:1728–1731. - PubMed

Publication types

MeSH terms