

Regulatory pathway analysis by high-throughput in situ hybridization
- PMID: 17953485
- PMCID: PMC2041993
- DOI: 10.1371/journal.pgen.0030178
Regulatory pathway analysis by high-throughput in situ hybridization
Abstract
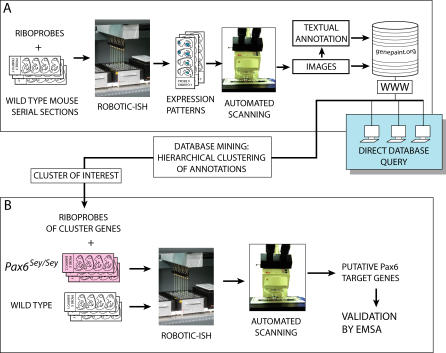
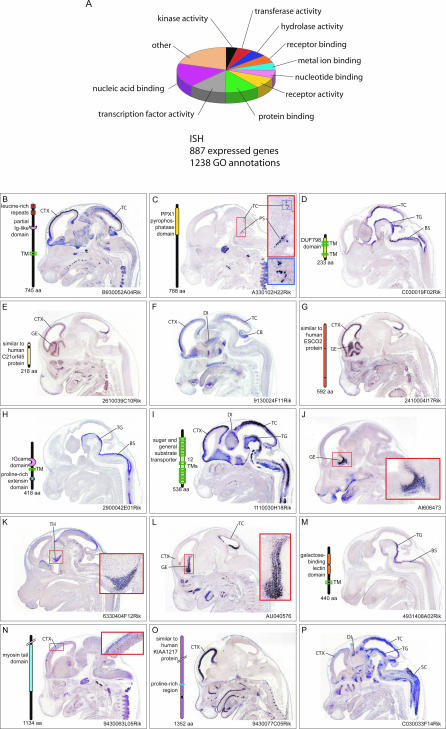
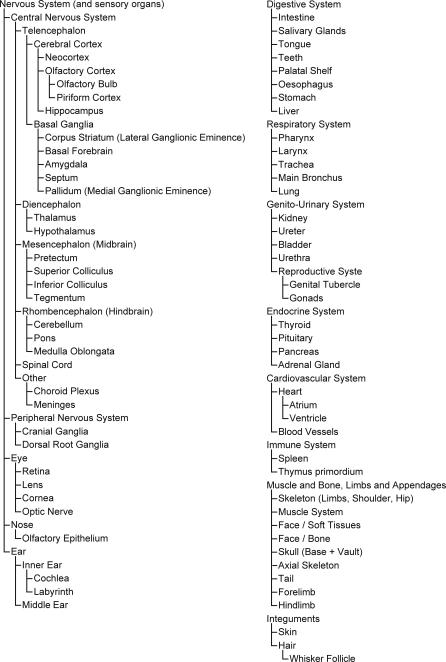
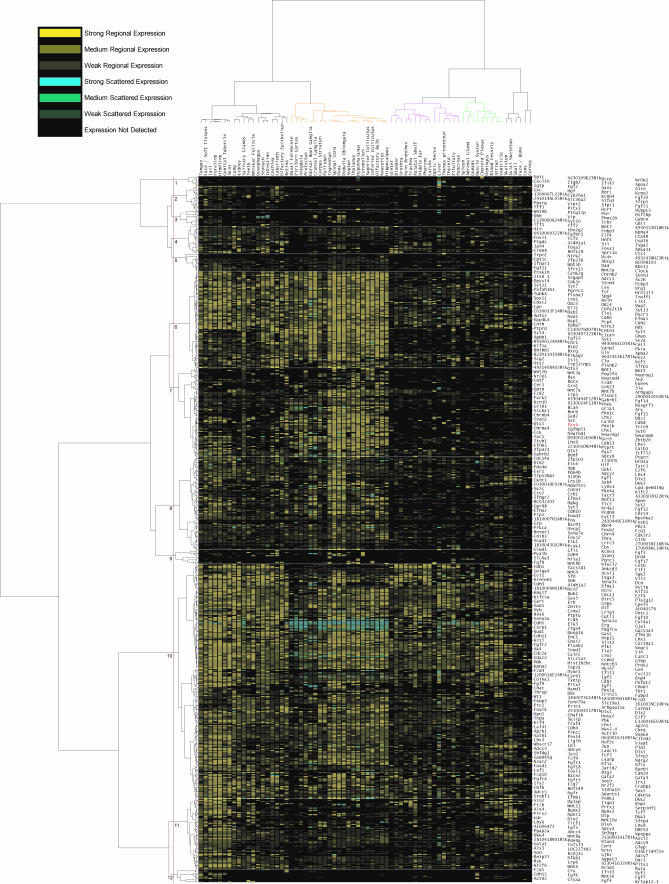
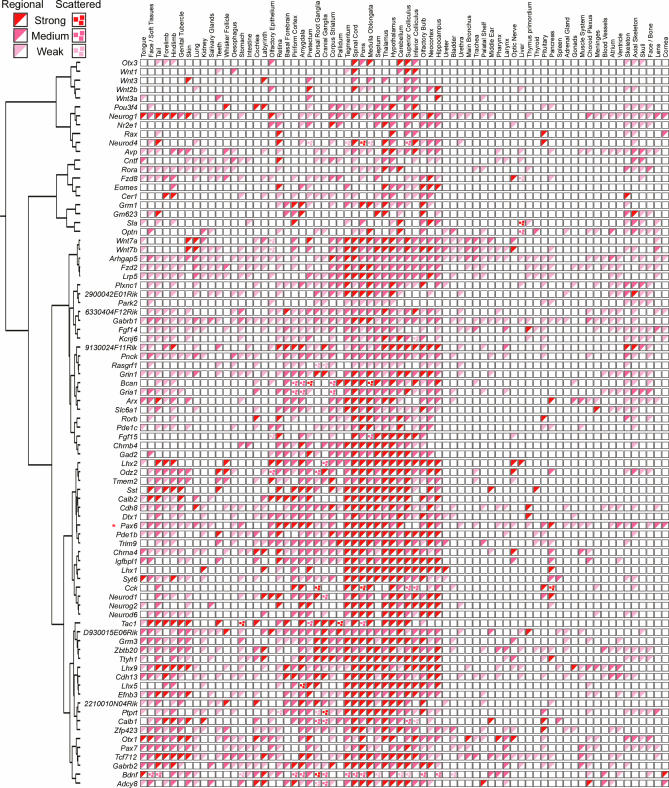
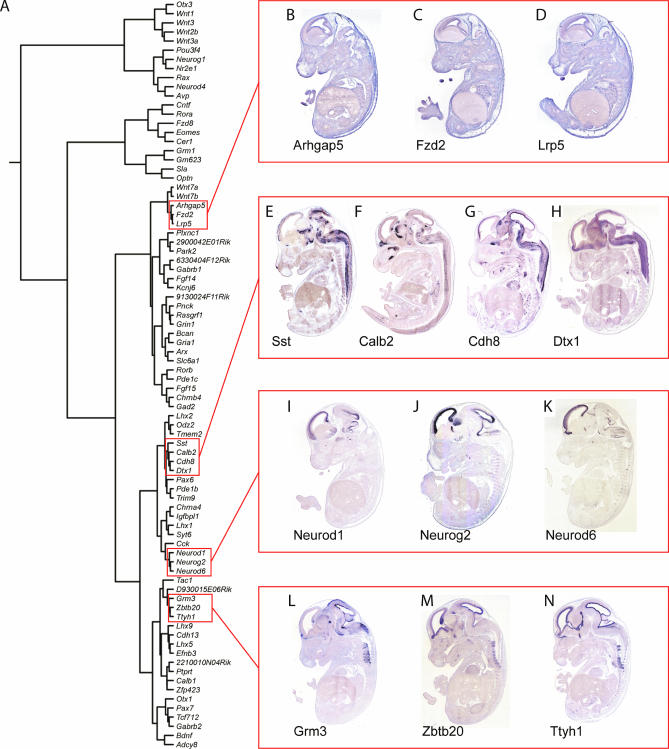
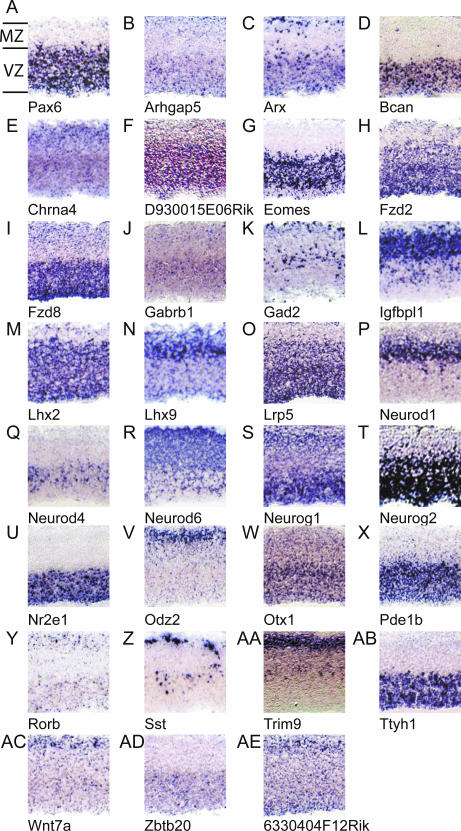
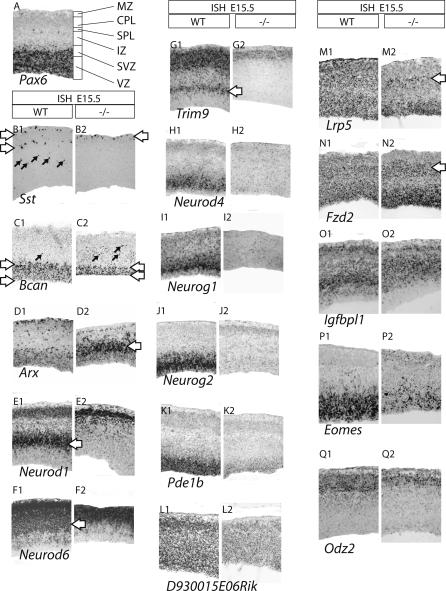
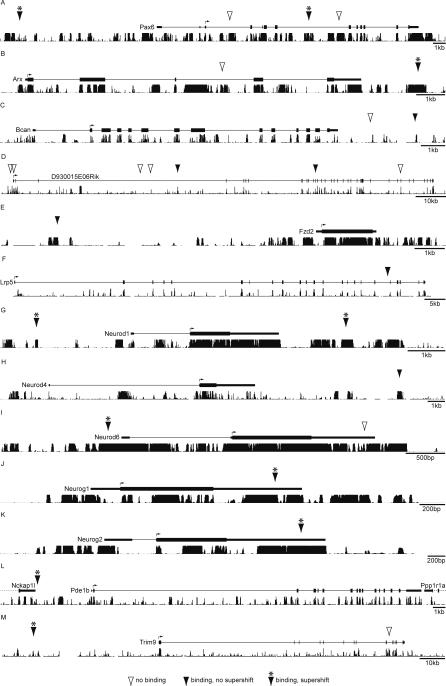
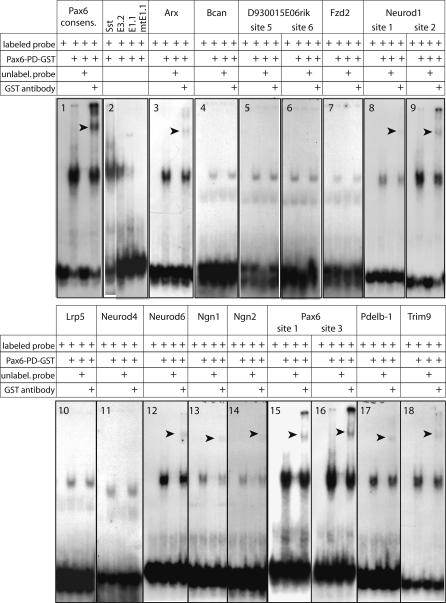
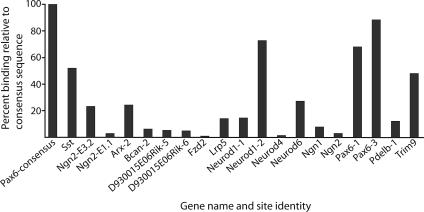
Automated in situ hybridization enables the construction of comprehensive atlases of gene expression patterns in mammals. Such atlases can become Web-searchable digital expression maps of individual genes and thus offer an entryway to elucidate genetic interactions and signaling pathways. Towards this end, an atlas housing approximately 1,000 spatial gene expression patterns of the midgestation mouse embryo was generated. Patterns were textually annotated using a controlled vocabulary comprising >90 anatomical features. Hierarchical clustering of annotations was carried out using distance scores calculated from the similarity between pairs of patterns across all anatomical structures. This process ordered hundreds of complex expression patterns into a matrix that reflects the embryonic architecture and the relatedness of patterns of expression. Clustering yielded 12 distinct groups of expression patterns. Because of the similarity of expression patterns within a group, members of each group may be components of regulatory cascades. We focused on the group containing Pax6, an evolutionary conserved transcriptional master mediator of development. Seventeen of the 82 genes in this group showed a change of expression in the developing neocortex of Pax6-deficient embryos. Electromobility shift assays were used to test for the presence of Pax6-paired domain binding sites. This led to the identification of 12 genes not previously known as potential targets of Pax6 regulation. These findings suggest that cluster analysis of annotated gene expression patterns obtained by automated in situ hybridization is a novel approach for identifying components of signaling cascades.
Conflict of interest statement
Competing interests. The authors have declared that no competing interests exist.
Figures
Similar articles
-
Cellular retinaldehyde-binding protein (CRALBP) is a direct downstream target of transcription factor Pax6.Biochim Biophys Acta. 2012 Feb;1820(2):151-6. doi: 10.1016/j.bbagen.2011.09.015. Epub 2011 Oct 4. Biochim Biophys Acta. 2012. PMID: 21996446
-
Eye-specific expression of an ancestral jellyfish PaxB gene interferes with Pax6 function despite its conserved Pax6/Pax2 characteristics.Int J Dev Biol. 2009;53(4):469-82. doi: 10.1387/ijdb.082793jr. Int J Dev Biol. 2009. PMID: 19378250
-
The Optimedin gene is a downstream target of Pax6.J Biol Chem. 2005 Oct 21;280(42):35228-37. doi: 10.1074/jbc.M506195200. Epub 2005 Aug 22. J Biol Chem. 2005. PMID: 16115881
-
Interplay of Pax6 and SOX2 in lens development as a paradigm of genetic switch mechanisms for cell differentiation.Int J Dev Biol. 2004;48(8-9):819-27. doi: 10.1387/ijdb.041868hk. Int J Dev Biol. 2004. PMID: 15558474 Review.
-
More than a decade of developmental gene expression atlases: where are we now?Nucleic Acids Res. 2009 Dec;37(22):7349-59. doi: 10.1093/nar/gkp819. Nucleic Acids Res. 2009. PMID: 19822576 Free PMC article. Review.
Cited by
-
Web-based digital gene expression atlases for the mouse.Mamm Genome. 2012 Oct;23(9-10):525-38. doi: 10.1007/s00335-012-9413-3. Epub 2012 Aug 31. Mamm Genome. 2012. PMID: 22936000 Review.
-
Integrated annotation and analysis of in situ hybridization images using the ImAnno system: application to the ear and sensory organs of the fetal mouse.PLoS One. 2015 Feb 23;10(2):e0118024. doi: 10.1371/journal.pone.0118024. eCollection 2015. PLoS One. 2015. PMID: 25706271 Free PMC article.
-
PTPRT regulates high-fat diet-induced obesity and insulin resistance.PLoS One. 2014 Jun 20;9(6):e100783. doi: 10.1371/journal.pone.0100783. eCollection 2014. PLoS One. 2014. PMID: 24949727 Free PMC article.
-
Reconstruction of the gene regulatory network involved in the sonic hedgehog pathway with a potential role in early development of the mouse brain.PLoS Comput Biol. 2014 Oct 9;10(10):e1003884. doi: 10.1371/journal.pcbi.1003884. eCollection 2014 Oct. PLoS Comput Biol. 2014. PMID: 25299227 Free PMC article.
-
Transcriptional and epigenetic mechanisms of early cortical development: An examination of how Pax6 coordinates cortical development.J Comp Neurol. 2016 Feb 15;524(3):609-29. doi: 10.1002/cne.23866. Epub 2015 Aug 25. J Comp Neurol. 2016. PMID: 26304102 Free PMC article. Review.
References
-
- Friedman A, Perrimon N. Genetic screening for signal transduction in the era of network biology. Cell. 2007;128:225–231. - PubMed
-
- Niehrs C, Pollet N. Synexpression groups in eukaryotes. Nature. 1999;402:483–487. - PubMed
-
- Lein ES, Hawrylycz MJ, Ao N, Ayres M, Bensinger A, et al. Genome-wide atlas of gene expression in the adult mouse brain. Nature. 2007;445:168–176. - PubMed
-
- Magdaleno S, Jensen P, Brumwell CL, Seal A, Lehman K, et al. BGEM: an in situ hybridization database of gene expression in the embryonic and adult mouse nervous system. PLoS Biol . 2006;4:e86. doi: 10.1371/journal.pbio.0040086. - DOI - PMC - PubMed
-
- Pollet N, Muncke N, Verbeek B, Li Y, Fenger U, et al. An atlas of differential gene expression during early Xenopus embryogenesis. Mech Dev. 2005;122:365–439. - PubMed
Publication types
MeSH terms
Substances
LinkOut - more resources
Full Text Sources
Molecular Biology Databases
