. 2007 Oct;3(10):1787-99.
doi: 10.1371/journal.pgen.0030190.

Copy number variants and common disorders: filling the gaps and exploring complexity in genome-wide association studies

Affiliations

Copy number variants and common disorders: filling the gaps and exploring complexity in genome-wide association studies

Xavier Estivill et al. PLoS Genet. 2007 Oct.

Abstract

Genome-wide association scans (GWASs) using single nucleotide polymorphisms (SNPs) have been completed successfully for several common disorders and have detected over 30 new associations. Considering the large sample sizes and genome-wide SNP coverage of the scans, one might have expected many of the common variants underpinning the genetic component of various disorders to have been identified by now. However, these studies have not evaluated the contribution of other forms of genetic variation, such as structural variation, mainly in the form of copy number variants (CNVs). Known CNVs account for over 15% of the assembled human genome sequence. Since CNVs are not easily tagged by SNPs, might have a wide range of copy number variability, and often fall in genomic regions not well covered by whole-genome arrays or not genotyped by the HapMap project, current GWASs have largely missed the contribution of CNVs to complex disorders. In fact, some CNVs have already been reported to show association with several complex disorders using candidate gene/region approaches, underpinning the importance of regions not investigated in current GWASs. This reveals the need for new generation arrays (some already in the market) and the use of tailored approaches to explore the full dimension of genome variability beyond the single nucleotide scale.


Conflict of interest statement

Competing interests. The authors have declared that no competing interests exist.

Figures

Figure 1
Figure 1. Types of Genomic Structural Changes Affecting Segments of DNA, Leading to Deletions, Duplications, Inversions, and CNV Changes (Biallelic, Multillelic, and Complex)
The only segment that is constant is “A.” Segment “B” varies in orientation in the inversion. Segments “C” and “D” show different types of variation.
Figure 2
Figure 2. Approaches Used for the Identification of CNVs and Other Types of Structural Changes in the Human Genome
Myriad methods and technologies have been employed to identify structural variants in the human genome. They are based on completely different experimental procedures and provide very different levels of resolution. The majority of findings (>80%) are attributable to a restricted number of high-throughput experiments with a limited resolution.
Figure 3
Figure 3. Expected and Observed Size Distribution of CNV Changes Identified to Date
Blue bars represent the frequencies of the currently identified CNVs in the size ranges depicted in the x-axis. A plausible scenario of variation in CNV size frequency is depicted as red vertical bars. An under-detection of variable fragments of small size (<50 kb) can be observed, which is likely due to technological limitations in the high-throughput assays used so far to identify CNVs, largely based on array CGH (Figure 2). Observed and expected CNVs that are >50 kb coincide, due to the powerful array methods, which cover the medium-to-large-size CNVs well. Dark blue bars represent the small-sized CNVs, which are more of a challenge to detect.
Figure 4
Figure 4. Genomic Organization of the Chemokine Cluster on Human Chromosome 17, Containing the CCL3L1 Gene (Red Arrows), Which Shows Variability in Copy Number and Association to HIV-1 Infectivity and AIDS Susceptibility
This region contains several segmental duplications and has been reported to vary in copy number in several studies. The Affymetrix 500K and Illumina HumanHap 550 arrays do not cover this region well, and completely lack SNPs in the CCL3L1/L3 gene (red dotted lines). A large number of gains and losses have been reported in the HapMap samples. Numbers in parentheses indicate the number of events involving genomic changes. CEU, European; HCB, Chinese; JPT, Japanese; YRI, African.
Figure 5
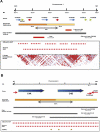
Figure 5. Schematic Representation of Two Genomic Regions That Involve CNVs Associated with SLE [65,66]
(A) The region of Chromosome 1 containing the FCGR3 gene cluster is highly variable and contains segmental duplications with a high sequence identity. Several CNVs have been reported that span this region. The genomic organization of the cluster is highly complex and not well solved in the current assembly of the genome sequence. The Affymetrix 500K and Illumina HumanHap 550 arrays do not cover this region well (red dotted lines). (B) The region of Chromosome 6p21, containing the C4A and C4B genes, is embedded in a region of complex genomic organization [67,69,70]. The region has been shown to contain segmental duplications and CNVs. The Affymetrix 500K and Illumina HumanHap 550 genotyping platforms do not cover this region, either (red dotted lines).
Figure 6
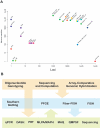
Figure 6. CNV Characterization Strategies
(A) Scales of resolution at the nucleotide level and maximum number of loci interrogated by the different methods (only the most widely used approaches are shown). (B) Diagram of different approaches in CNV analysis, either at the genome-wide scale or at individual/multiplex loci. Arrows indicate the deeper analysis that is needed after initial detection by one methodology or another. DASH, dynamic allele-specific hybridization [80]; PRT, paralogue ratio test [81]; MAQ, multiple amplicon quantification [82]; qPCR, quantitative PCR.

References

    1. The International HapMap Consortium. A haplotype map of the human genome. Nature. 2005;437:1299–1320. - PMC - PubMed
    1. The Welcome Trust Case Control Consortium. Genome-wide association study of 14,000 cases of seven common diseases and 3,000 shared controls. Nature. 2007;447:661–678. - PMC - PubMed
    1. Smyth DJ, Cooper JD, Bailey R, Field S, Burren O, et al. A genome-wide association study of nonsynonymous SNPs identifies a type 1 diabetes locus in the interferon-induced helicase (IFIH1) region. Nat Genet. 2006;38:617–619. - PubMed
    1. Saxena R, Voight BF, Lyssenko V, Burtt NP, de Bakker PI, et al. Genome-wide association analysis identifies loci for type 2 diabetes and triglyceride levels. Science. 2007;316:1331–1336. - PubMed
    1. Steinthorsdottir V, Thorleifsson G, Reynisdottir I, Benediktsson R, Jonsdottir T, et al. A variant in CDKAL1 influences insulin response and risk of type 2 diabetes. Nat Genet. 2007;39:770–775. - PubMed

Publication types