

Comparative Study
doi: 10.1186/gb-2007-8-10-r224.
A BAC clone fingerprinting approach to the detection of human genome rearrangements
Affiliations
- PMID: 17953769
- PMCID: PMC2246298
- DOI: 10.1186/gb-2007-8-10-r224
Item in Clipboard
Comparative Study
A BAC clone fingerprinting approach to the detection of human genome rearrangements
Genome Biol.
2007.
Abstract
We present a method, called fingerprint profiling (FPP), that uses restriction digest fingerprints of bacterial artificial chromosome clones to detect and classify rearrangements in the human genome. The approach uses alignment of experimental fingerprint patterns to in silico digests of the sequence assembly and is capable of detecting micro-deletions (1-5 kb) and balanced rearrangements. Our method has compelling potential for use as a whole-genome method for the identification and characterization of human genome rearrangements.
Figures

Desirability ranking of 4,060 five-enzyme combinations. We determined desirability of enzyme combinations based on S(n), defined as the fraction of the chromosome 7 that is represented by restriction fragments in the range 1-20 kb (a subset of our sizing range within which sizing accuracy is increased) for ≥n enzymes. Enzyme combinations with high values of S(n) are desirable because a large fraction of fragments in their fingerprint patterns can be accurately sized and because the number of large fragment covers found in regions represented exclusively by large fragments in all digests is minimized. Points represented by hollow glyphs correspond to enzyme combinations which achieved rank in top 10% for each of S(n = 1..5).

Specificity of individual restriction fragments and patterns based on exact and experimental sizing tolerance. (a) HindIII restriction fragment specificity for the human genome for fragments within the experimental size range of 500 bp to 30 kb. For a given fragment size, the vertical scale represents the fraction of fragments in the genome that are indistinguishable by size in the case of either exact sizing (fragments in common between two fingerprints must be of identical size) or within experimental tolerance (fragments in common between two fingerprints must be within experimental sizing error; Figure 3) on a fingerprinting gel. When sizing is exact, fragment specificity follows approximately the exponential distribution of fragment sizes and spans a range of 3.5 orders of magnitude. When experimental tolerance is included, the number of distinguishable fragment size bins is reduced and the range of fragment specificity drops to two orders of magnitude. (b) The specificity of a fingerprint pattern of a given size in the human genome. Fingerprint pattern size is measured in terms of number of fragments. Regions with identical patterns are those in which there is a 1:1 mapping within tolerance between all sizeable fragments. The specificity of experimental fingerprint patterns is cumulatively affected by specificity of individual fragments. The specificity of fragments is sufficiently low (that is, due to high experimental precision) so that 96.5% of the genome is uniquely represented by fragment patterns of 8 fragments or more.

Experimental error of fragment sizing within the 0.5-30 kb sizing range of our single digest protocol. The error is expressed in relative size (left axis) and standard mobility (right axis). Standard mobility is a distance unit that takes into account inter-gel variation and is approximately linear with the distance traveled by the fragment on the gel.
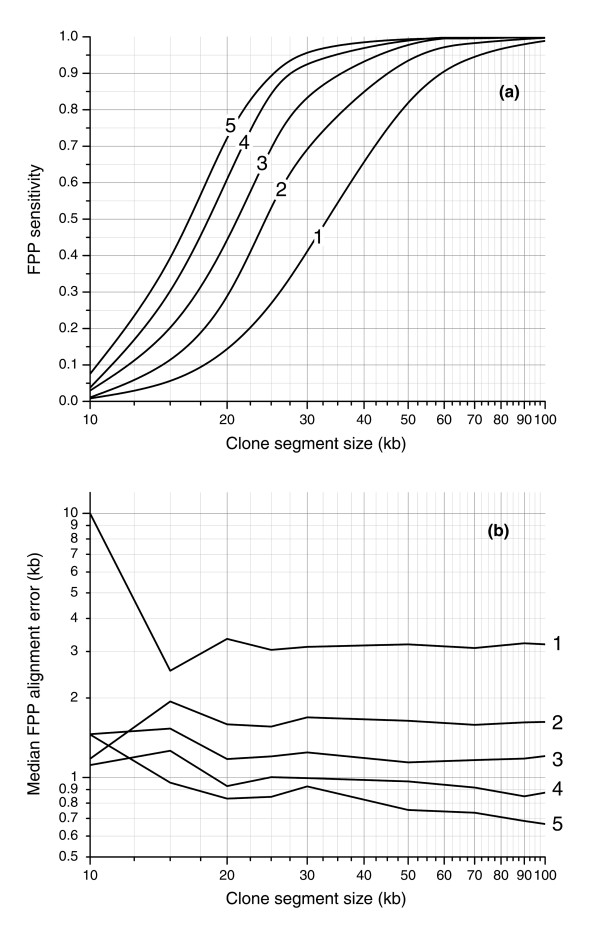
Simulation results of sensitivity and spatial error of rearrangement detection by FPP using experimental sizing tolerance. (a) Sensitivity is measured as the fraction of clone regions of a given size with successful FPP alignments and is plotted for five digests (labeled 1-5). (b) Spatial error is measured by the median distance between FPP and theoretical alignment positions. The largest improvement in both sensitivity and spatial error is realized by migrating FPP from one digest to two. With two fingerprint patterns used to align the clone, 50% of >25 kb clone regions are aligned (90% of >45 kb regions) with a spatial error of 1.7 kb.

PCR reactions validating the presence of breakpoints in clones listed in Table 5. Each reaction is labeled by the primer combination (e.g. AR+ CL+) used to test order and orientation of the clone's fused regions (Materials and methods; primer combination nomenculature is described in detail in Additional data file 1). The presence of a product demonstrates the adjacency of the regions within the clone's insert.

Detailed reconciliation of sequence and fingerprint alignments for clone 3F05, which contains at least four internal breakpoints. FPP is capable of dissecting complex rearrangements in a clone, as illustrated in this figure showing the internal structure of M0003F05. This BAC was sequenced [26] and found to be composed of content from at least five distinct regions (A-E). FPP detected 4/5 of these regions. BLAT (grey rectangles with alignment orientation arrows) and FPP (thin black lines) alignments of M0003F05 are shown; values underneath coordinate pairs are differences in edge positions between BLAT and FPP alignments.

PCR reactions validating small-scale aberrations listed in Table 6. Reactions are labeled A-D, corresponding to the aberrations with the same label in Table 6. In each case the observed product sizes, shown here, are different from the expected sizes based on the inter-primer distance on the reference sequence.

Expected fraction of breakpoints, given five-fold redundant clone coverage, captured by ≥N clones with the distance between breakpoint and clone terminus larger than detection cutoff. The plot shows detection profiles for 150 kb and 220 kb clones. The plot illustrates the benefit of redundant coverage and of using clones with larger inserts - for a given detection cutoff, a breakpoint is captured by significantly more clones on average. The detection sensitivity (Figure 4) needs to be applied to the fraction of breakpoints on this plot (for example, 80% of breakpoints found in ≥2 clones within 50 kb of the ends of the clone; assuming 2 digests, 95% of 50 kb regions can be aligned (Figure 4); therefore, 80% × 0.95 = 76% of breakpoints are expected to be detected in these conditions).
References
Publication types
MeSH terms
Substances
Grants and funding
LinkOut - more resources
Full Text Sources
