Review
. 2008 May;101(8):1065-87.
doi: 10.1093/aob/mcm246. Epub 2007 Oct 21.

Models for forest ecosystem management: a European perspective

Affiliations
Review

Models for forest ecosystem management: a European perspective

H Pretzsch et al. Ann Bot. 2008 May.

Abstract

Background: Forest management in Europe is committed to sustainability. In the face of climate change and accompanying risks, however, planning in order to achieve this aim becomes increasingly challenging, underlining the need for new and innovative methods. Models potentially integrate a wide range of system knowledge and present scenarios of variables important for any management decision. In the past, however, model development has mainly focused on specific purposes whereas today we are increasingly aware of the need for the whole range of information that can be provided by models. It is therefore assumed helpful to review the various approaches that are available for specific tasks and to discuss how they can be used for future management strategies.

Scope: Here we develop a concept for the role of models in forest ecosystem management based on historical analyses. Five paradigms of forest management are identified: (1) multiple uses, (2) dominant use, (3) environmentally sensitive multiple uses, (4) full ecosystem approach and (5) eco-regional perspective. An overview of model approaches is given that is dedicated to this purpose and to developments of different kinds of approaches. It is discussed how these models can contribute to goal setting, decision support and development of guidelines for forestry operations. Furthermore, it is shown how scenario analysis, including stand and landscape visualization, can be used to depict alternatives, make long-term consequences of different options transparent, and ease participation of different stakeholder groups and education.

Conclusions: In our opinion, the current challenge of forest ecosystem management in Europe is to integrate system knowledge from different temporal and spatial scales and from various disciplines. For this purpose, using a set of models with different focus that can be selected from a kind of toolbox according to particular needs is more promising than developing one overarching model, covering ecological, production and landscape issues equally well.


Figures

F<sc>ig</sc>. 1.
Fig. 1.
Concept for the management of forest ecosystems. Starting with an initial state (forest stand, stratum of a forest estate, landscape unit) a system is transformed into a target state. Normative valuation by the society and scientific knowledge contribute to the development and achievement of the target state.
F<sc>ig</sc>. 2.
Fig. 2.
Scenario analysis with forest stand models. Starting with an initial state of an ecosystem, models display the long-term consequences of the different management options A, B, C and D and the consideration of different objective states.
F<sc>ig</sc>. 3.
Fig. 3.
Map from the ‘Lorenzer Wald’ near Nürnberg, Germany, as simple model for forest ecosystem management. By locating forest resources like hunting grounds, beehives, and mature forests ready for harvest this map from Paulus Pfinzing supported the multiple use paradigm in the 16th century (Hilf, 1938, pp. 184–185).
F<sc>ig</sc>. 4.
Fig. 4.
Principle of management models predicting the shift of the diameter or height distribution along the x-axis (after Sloboda, 1976).
F<sc>ig</sc>. 5.
Fig. 5.
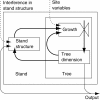
Simplified system diagram of the growth model SILVA 2·2 with the levels stand and tree, the external variables inference in stand structure and site conditions and the feedback loop stand structure → growth → tree dimension → stand structure.
F<sc>ig</sc>. 6.
Fig. 6.
SILVA 2·2 breaks down forest stands into a mosaic of individual trees and reproduces their interactions as a space–time system. Excerpt of a simulation run for a mixed stand with two species (slight thinning from below) (Pretzsch, 2001, p. 256).
F<sc>ig</sc>. 7.
Fig. 7.
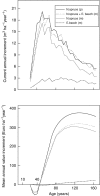
Scenario analysis with SILVA2·2 on stand level. Current annual volume growth (top) and mean annual value increment (bottom) in pure stands of Norway spruce compared with mixed stands of Norway spruce and European beech (Pretzsch, 2001, pp. 258–261).
F<sc>ig</sc>. 8.
Fig. 8.
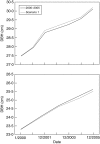
Mean course of the diameter at breast height for the spruce (above) and the beech trees (below) of a mixed forest stand in southern Germany over the period 2000–2005 and of the climate scenario.
F<sc>ig</sc>. 9.
Fig. 9.
Mean annual biomass increment (tonnes carbon) of a mixed forest stand in Southern Germany for the period 2000–2006 and for the climate scenario.
F<sc>ig</sc>. 10.
Fig. 10.
Distributions of dominant tree species in the Dischma valley simulated with LandClim for (A) current climate conditions (3·2 °C mean annual temperature, 900 mm mean annual precipitation) and (B) a climate warming scenario (6·2 °C mean annual temperature, 700 mm mean annual precipitation).
F<sc>ig</sc>. 11.
Fig. 11.
An example of TREEVIEW output, with interactively selected trees for thinning and selected future trees.
F<sc>ig</sc>. 12.
Fig. 12.
TREEVIEW can visualize the output of BALANCE and display various tree compartment attributes as false colours. Here the biomass density is used for colouration.
F<sc>ig</sc>. 13.
Fig. 13.
Example of the use of L-VIS for displaying landscape planning of a street project. Parcells with high risk from wind are coloured in red.
F<sc>ig</sc>. 14.
Fig. 14.
An output of L-VIS on landscape level at various time steps. The integrated interplation routines offer time to the user as a real dimension in which he or she can continuously navigate.
F<sc>ig</sc>. 15.
Fig. 15.
Management models support decisions within a given decision corridor (framed arrows) by prognosticating the long-term consequences of treatment variants (mobile arrows). The corridor can be explored by application of mechanistic model approaches on stand and landscape levels.

References

    1. Aber JD, Federer CA. A generalized, lumped parameter model of photosynthesis, evaporation and net primary production in temperate and boreal forest ecosystems. Oecologia. 1992;92:463–474. - PubMed
    1. Aber JD, Ollinger SV, Federer CA, Reich PB, Goulden ML, Kicklighter DW, et al. Predicting the effects of climate change on water yield and forest production in the northeastern United States. Climate Research. 1995;5:207–222.
    1. Aber JD, Ollinger SV, Driscoll CT, Likens GE, Holmes RT, Freuder RJ, Goodale CL. Inorganic nitrogen losses from a forested ecosystem in response to physical, chemical, biotic,and climatic perturbations. Ecosystems. 2002;5:648–658.
    1. Almeida AC, Landsberg JJ, Sands PJ, Ambrogi MS, Fonseca S, Barddal SM, Bertolucci FL. Needs and opportunities for using a process-based productivity model as a practical tool in Eucalyptus plantations. Forest Ecology and Management. 2004;193:167–177.
    1. Alveteg M. Projecting regional patterns of future soil chemistry status in Swedish forests using SAFE. Water, Air, and Soil Pollution: Focus. 2004;4:49–59.

Publication types