. 2007 Oct 22;179(2):269-76.
doi: 10.1083/jcb.200706053.

Differences between homologous alleles of olfactory receptor genes require the Polycomb Group protein Eed

Affiliations

Differences between homologous alleles of olfactory receptor genes require the Polycomb Group protein Eed

Mary Kate Alexander et al. J Cell Biol. .

Abstract

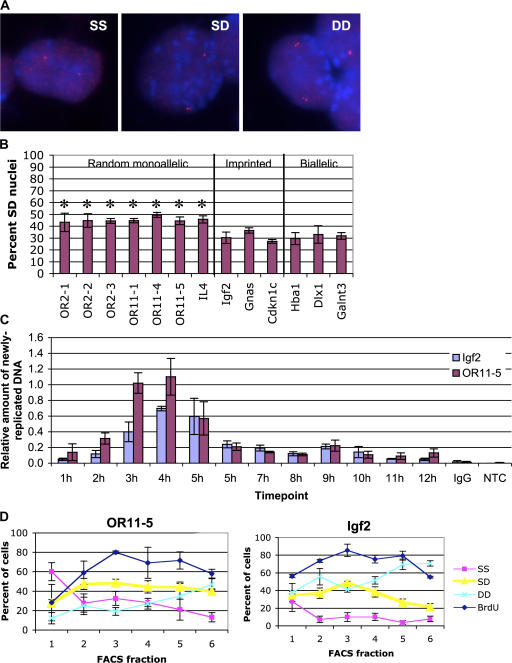
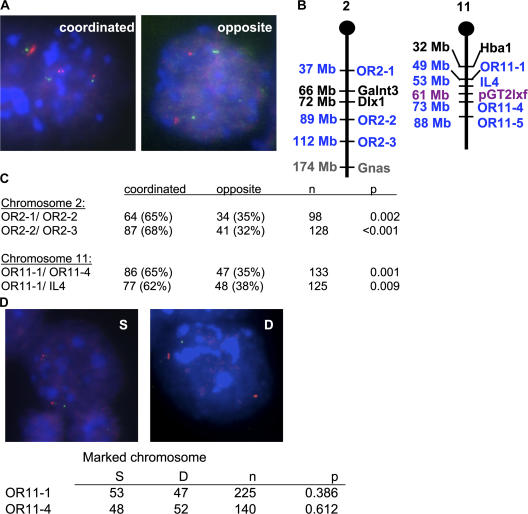
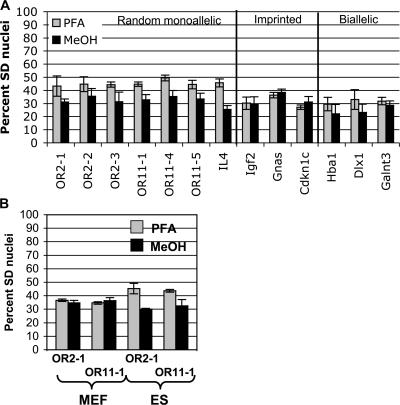
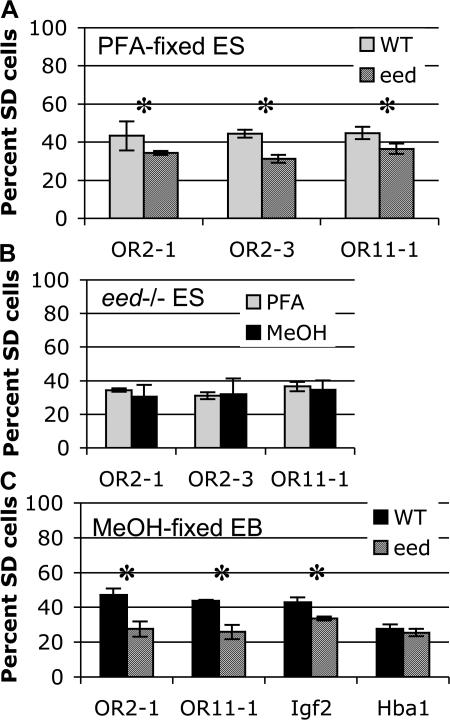
A number of mammalian genes are expressed from only one of the two homologous chromosomes, selected at random in each cell. These include genes subject to X-inactivation, olfactory receptor (OR) genes, and several classes of immune system genes. The means by which monoallelic expression is established are only beginning to be understood. Using a cytological assay, we show that the two homologous alleles of autosomal random monoallelic loci differ from each other in embryonic stem (ES) cells, before establishment of monoallelic expression. The Polycomb Group gene Eed is required to establish this distinctive behavior. In addition, we found that when Eed mutant ES cells are differentiated, they fail to establish asynchronous replication timing at OR loci. These results suggest a common mechanism for random monoallelic expression on autosomes and the X chromosome, and implicate Eed in establishing differences between homologous OR loci before and after differentiation.


Figures

Figure 1.
Figure 1.
Autosomal random monoallelic genes display SIAR. (A) Representative FISH images of cells displaying SS, SD, or DD signals. DNA-FISH was performed on wild-type ES cells using the OR probe OR11-5 (Table I) labeled with Cy3 (red). DNA was stained with DAPI (blue). OR probes tended to show a relatively high nonspecific background signal by FISH, probably due to cross-hybridization with other OR genes. (B) Quantitation of the percentage of nuclei displaying SD FISH signals for the random monoallelic OR and IL-4 loci; the imprinted genes Igf2, Gnas, and Cdkn1c; and the biallellically expressed genes Hba1, Dlx1, and Galnt3. Asterisks indicate samples with a significantly greater % SD than Hba1 using an unpaired t test (P ≤ 0.001). Error bars represent one standard deviation in each direction. See Fig. S1 for complete scoring of SS, SD, and DD signals (available at http://www.jcb.org/cgi/content/full/jcb.200706053/DC1). (C) Replication timing assay. Cells were arrested in G1 with mimosine, and released. At 1-h intervals, cells were BrdU labeled, DNA was isolated, and BrdU-containing DNA was immunoprecipitated. Sequences from OR11-5 (specifically, the OR gene Olfr464), Igf2, and a loading control, consisting of BrdU-labeled human DNA added before immunoprecipitation, were analyzed by quantitative PCR amplification. Water (no template control, NTC) and DNA immunoprecipitated with nonspecific serum (IgG) were amplified as negative controls. PCR primer sequences are given in Table II. (D) Percentage of nuclei with SD FISH signals in FACS fractions. DNA was stained with Hoeschst, and cells were sorted (Fig. S1) by DNA content onto slides. FISH was performed on PFA-fixed cells using probes to the OR array OR11-5 and the imprinted gene Igf2. Percent BrdU positive (blue diamonds), singlet/singlet (SS; pink squares), singlet/doublet (SD; yellow triangles), and doublet/doublet (DD; aqua crosses) cells are shown. Both OR11-5 and Igf2 showed the expected decrease in the percentage of SS cells in the early fractions and the expected increase in DD signals in later fractions. Error bars represent one standard deviation in each direction. For Igf2, the fraction of SD cells in fraction 3 was significantly higher than in fractions 1, 5, and 6 (P ≤ 0.001) and somewhat higher than in fractions 2 and 4 (P < 0.05) based on a t test. For OR11-5, the frequency of SD cells was significantly lower in fraction 1 (P < 0.005) than in the remainder of the fractions.
Figure 2.
Figure 2.
SIAR of autosomal genes is coordinated and switchable. (A) Appearance of random monoallelic loci as SD FISH signals is coordinated along the length of a chromosome. Representative FISH images of cells displaying coordinated or opposite SD signals for pairs of OR probes on the same chromosome. DNA-FISH was performed on wild-type ES cells using the OR probes OR11-1 (left) or OR2-3 (right) labeled with Cy3 (red), and OR11-4 (left) or OR2-2 (right) labeled with biotin and detected with FITC-avidin (green). DNA was stained with DAPI (blue). (B) Locations of loci examined on chromosomes 2 and 11. OR arrays are named according to the system of Zhang and Firestein (2002). Random monoallelic genes are labeled in blue, biallelic genes in black, imprinted genes in gray, and the chromosome 11 transgene used as a marker in violet. (C) Quantitation of the percentage of cells displaying coordinated or opposite SD signals for four pairs of probes. A χ-square test was used to determine P values for coordination, with a null hypothesis of no coordination. (D) The identities of the singlet and doublet alleles are not fixed in ES cells. Representative FISH images of cells from a clonal population displaying a singlet or doublet signal on a marked chromosome. Combined RNA/DNA-FISH was performed on ES cells carrying a transgene on one copy of chromosome 11 (BayGenomics line RRR379) using the OR probes OR11-1 labeled with Cy3 (red), and plasmid pGT2lxf labeled with FITC (green). Because OR genes are not expressed in ES cells, these probes detected DNA only; the pGT2lxf probe detected both RNA and DNA. The frequency of SD FISH signals for each probe by itself in RRR379 ES cells was comparable to that in wild-type male (E14) or female (ES2-1) ES cells (not depicted). DNA was stained with DAPI (blue). Quantitation of the percentage of cells displaying a singlet or doublet signal for the OR11-1 or OR11-4 probe on the pGT2lxf-containing chromosome are given in the table below. A χ-square test was used to determine P values, with a null hypothesis of a locus on the marked chromosome being equally likely to appear as a singlet or a doublet.
Figure 3.
Figure 3.
SIAR is dependent on intact nuclear structure and precedes establishment of monoallelic expression. (A) SD FISH signals for random monoallelic genes, but not imprinted genes, are reduced in methanol-fixed samples. FISH was performed on MeOH-fixed wild-type ES cells using probes for random monoallelic OR genes and IL-4; the imprinted genes Igf2, Gnas, and Cdkn1c; and the biallellically expressed genes Dlx1, Hba1, and Galnt3 (data for PFA-fixed cells is provided for comparison, and is the same as in Fig. 1 B). The frequency of SD FISH signals in PFA-fixed (gray) and MeOH-fixed (black) samples is shown. Error bars represent one standard deviation in each direction. The observed frequency of SD FISH signals for Hba1 and Igf2 in MeOH-fixed ES cells was consistent with previously published work (Simon et al., 1999; Gribnau et al., 2003). See Fig. S2 for complete scoring of SS, SD, and DD signals in MeOH-fixed cells and a statistical analysis of the difference between PFA- and MeOH-fixed cells (available at http://www.jcb.org/cgi/content/full/jcb.200706053/DC1). (B) Differentiated cells do not display SIAR. DNA-FISH was performed on PFA- (gray) and MeOH-fixed (black) wild-type MEFs using OR array probes OR11-1 and OR11-4. Data for ES cells (Fig. 1 B and Fig. 2 B) is shown for comparison. Error bars represent one standard deviation in each direction. The observed frequency of SD FISH signals for OR arrays in MeOH-fixed MEFs was consistent with previously published work (Chess et al., 1994; Simon et al., 1999). See Fig. S3 for complete scoring of SS, SD, and DD signals in PFA- and MeOH-fixed MEFs (available at http://www.jcb.org/cgi/content/full/jcb.200706053/DC1).
Figure 4.
Figure 4.
Eed is required for SIAR. (A) Mutation of Eed reduces SIAR in ES cells. The frequency of SD FISH signals for three OR arrays in PFA-fixed wild-type (gray) and Eed knockout (striped) ES cells is shown. Asterisks indicate a significant difference between wild-type and Eed as determined by an unpaired t test (P < 0.005). Error bars represent one standard deviation in each direction. See Fig. S4 for complete scoring of SS, SD, and DD signals (available at http://www.jcb.org/cgi/content/full/jcb.200706053/DC1). (B) PFA-fixed and MeOH-fixed Eed / ES cells display a similar frequency of SD signals. The frequency of SD FISH signals for three OR arrays in PFA-fixed (gray) and MeOH-fixed (black) Eed knockout ES cells is shown. Error bars represent one standard deviation in each direction. See Fig. S4 for complete scoring of SS, SD, and DD signals. (C) Asynchronous replication of random monoallelic loci is lost in differentiated Eed / cells. The frequency of SD FISH signals for two OR arrays, Igf2, and Hba1 in MeOH-fixed wild-type (black) and Eed knockout (striped) differentiated cells is shown. EBs were differentiated for 17 d, and differentiation was tested using an alkaline phosphatase assay. 97.5% of wild-type cells and 95% of Eed / cells were negative for phosphatase activity. Asterisks indicate a significant difference between wild-type and Eed as determined by an unpaired t test (P < 0.001). Error bars represent one standard deviation in each direction. See Fig. S4 for complete scoring of SS, SD, and DD signals.

References

    1. Cebra, J.J., J.E. Colberg, and S. Dray. 1966. Rabbit lymphoid cells differentiated with respect to alpha-, gamma-, and mu-heavy polypeptide chains and to allotypic markers Aa1 and Aa2. J. Exp. Med. 123:547–558. - PMC - PubMed
    1. Chess, A., I. Simon, H. Cedar, and R. Axel. 1994. Allelic inactivation regulates olfactory receptor gene expression. Cell. 78:823–834. - PubMed
    1. DeChiara, T.M., E.J. Robertson, and A. Efstratiadis. 1991. Parental imprinting of the mouse insulin-like growth factor II gene. Cell. 64:849–859. - PubMed
    1. Ensminger, A.W., and A. Chess. 2004. Coordinated replication timing of monoallelically expressed genes along human autosomes. Hum. Mol. Genet. 13:651–658. - PubMed
    1. Gimelbrant, A.A., and A. Chess. 2006. An epigenetic state associated with areas of gene duplication. Genome Res. 16:723–729. - PMC - PubMed

Publication types