

Changes in survival among elderly patients initiating dialysis from 1990 to 1999
- PMID: 17954892
- PMCID: PMC2025619
- DOI: 10.1503/cmaj.061765
Changes in survival among elderly patients initiating dialysis from 1990 to 1999
Abstract
Background: Over the past decade, there has been a steep rise in the number of people with complex medical problems who require dialysis. We sought to determine the life expectancy of elderly patients after starting dialysis and to identify changes in survival rates over time.
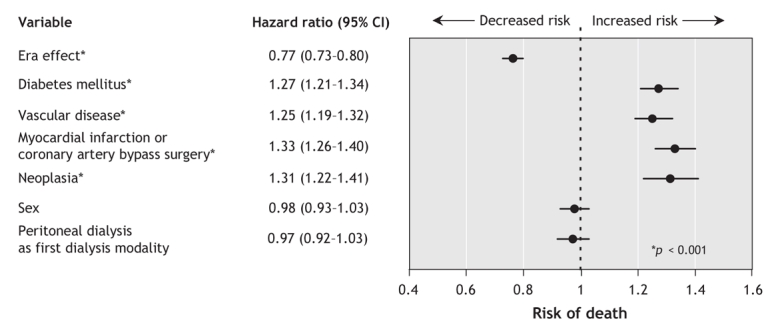
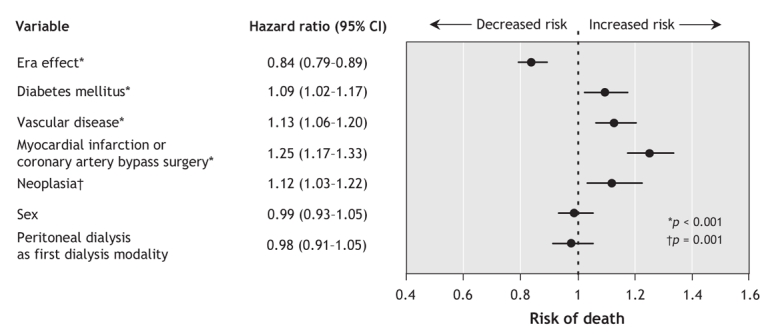
Methods: All patients aged 65 years or older who began dialysis in Canada between 1990 and 1999 were identified from the Canadian Organ Replacement Register. We used Cox proportional hazards models to examine the effect that the period during which dialysis was initiated (era 1, 1990-1994; era 2, 1995-1999) had on patient survival, after adjusting for diabetes, sex and comorbidity. Patients were followed from initiation of dialysis until death, transplantation, loss to follow-up or study end (Dec. 31, 2004).
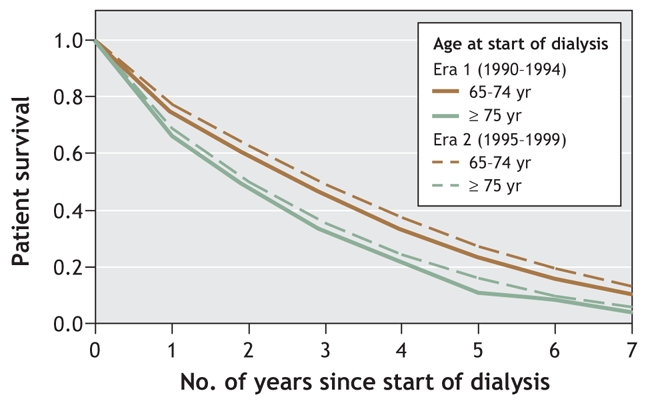
Results: A total of 14,512 patients aged 65 years or older started dialysis between 1990 and 1999. The proportion of these patients who were 75 years or older at the start of dialysis increased from 32.7% in era 1 (1990-1994) to 40.0% in era 2 (1995-1999). Despite increased comorbidity over the 2 study periods, the unadjusted 1-, 3- and 5-year survival rates among patients aged 65-74 years at dialysis initiation rose from 74.4%, 44.9% and 25.8% in era 1 to 78.1%, 51.5% and 33.5% in era 2. The respective survival rates among those aged 75 or more at dialysis initiation increased from 67.2%, 32.3% and 14.2% in era 1 to 69.0%, 36.7% and 20.3% in era 2. This survival advantage persisted after adjustment for diabetes, sex and comorbidity in both age groups (65-74 years: hazard ratio [HR] 0.76, 95% confidence interval [CI] 0.72- 0.81; 75 years or more: HR 0.86, 95% CI 0.80-0.92).
Interpretation: Survival after dialysis initiation among elderly patients has improved from 1990 to 1999, despite an increasing burden of comorbidity. Physicians may find these data useful when discussing prognosis with elderly patients who are initiating dialysis.
Figures
Comment in
-
Mortality trends among Canadian patients receiving dialysis.CMAJ. 2007 Oct 23;177(9):1055-6. doi: 10.1503/cmaj.071247. CMAJ. 2007. PMID: 17954895 Free PMC article. No abstract available.
References
-
- Hsu CY, Vittinghoff E, Lin F, et al. The incidence of end-stage renal disease is increasing faster than the prevalence of chronic renal insufficiency. Ann Intern Med 2004;141:95-101. - PubMed
-
- Muntner P, Coresh J, Powe NR, et al. The contribution of increased diabetes prevalence and improved myocardial infarction and stroke survival to the increase in treated end-stage renal disease. J Am Soc Nephrol 2003;14:1568-77. - PubMed
-
- Mix TC, St Peter WL, Ebben J, et al. Hospitalization during advancing chronic kidney disease. Am J Kidney Dis 2003;42:972-81. - PubMed
-
- Kidney Failure on the Rise, Seniors Constitute 50% of New Patients, reports Canadian Institute for Health Information. CIHI. 7-4-2001.
-
- Canadian Institute for Health Information. Canadian Organ Replacement Register – data quality. Ottawa: The Institute. Available: http://secure.cihi.ca/cihiweb/dispPage.jsp?cw_page=services_corr_e#quality (accessed 2007 july 18).
Publication types
MeSH terms
LinkOut - more resources
Full Text Sources
Medical
Research Materials
Miscellaneous