. 2007 Oct 30;104(44):17494-9.
doi: 10.1073/pnas.0708572104. Epub 2007 Oct 22.

Identification of differentially expressed proteins in ovarian cancer using high-density protein microarrays

Affiliations

Identification of differentially expressed proteins in ovarian cancer using high-density protein microarrays

Michael E Hudson et al. Proc Natl Acad Sci U S A. .

Abstract

Ovarian cancer is a leading cause of deaths, yet many aspects of the biology of the disease and a routine means of its detection are lacking. We have used protein microarrays and autoantibodies from cancer patients to identify proteins that are aberrantly expressed in ovarian tissue. Sera from 30 cancer patients and 30 healthy individuals were used to probe microarrays containing 5,005 human proteins. Ninety-four antigens were identified that exhibited enhanced reactivity from sera in cancer patients relative to control sera. The differential reactivity of four antigens was tested by using immunoblot analysis and tissue microarrays. Lamin A/C, SSRP1, and RALBP1 were found to exhibit increased expression in the cancer tissue relative to controls. The combined signals from multiple antigens proved to be a robust test to identify cancerous ovarian tissue. These antigens were also reactive with tissue from other types of cancer and thus are not specific to ovarian cancer. Overall our studies identified candidate tissue marker proteins for ovarian cancer and demonstrate that protein microarrays provide a powerful approach to identify proteins aberrantly expressed in disease states.


Conflict of interest statement

Conflict of interest statement: M.S. consults for Invitrogen Corporation and Affomix Corporation. M.H. currently works for Microbia Precision Engineering.

Figures
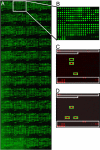
Fig. 1.
Fig. 1.
Identification of tumor-associated autoantibodies and targeted protein antigens. (A) A protein microarray comprising 5,005 GST fusion proteins probed with anti-GST antibody. (B and C) Proteins visualized with anti-GST antibody (B) or with serum from ovarian cancer patients and healthy women (C). White boxes, positive and negative controls; green boxes, reactive proteins.
Fig. 2.
Fig. 2.
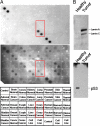
Immunoblot analysis of candidate tumor markers. (A) Filters spotted with protein lysates were probed with anti-lamin A/C (Top) and SSRPI (Middle) antibodies. The tissue origin of each sample is shown in the key (Bottom). (B) Western blot analysis of healthy and diseased ovarian tissue using antibodies specific for proteins lamin A/C (Upper) and p53 (Lower).
Fig. 3.
Fig. 3.
Identification of differentially expressed proteins in ovarian cancer. (A–C) Representative examples of staining of tissue microarrays containing tumor tissue and healthy tissue taken 1.5 cm apart were probed with antibodies specific for lamin A/C (A), SSRP1 (B), or CA-125 (C). In each staining, diseased tissue (upper row in pair) is compared with healthy tissue (lower row in pair). A full set of tissue staining images can be found in SI Figs. 7–10. (D) Staining scores for patients from both matched and unmatched tissue microarray cores. Open bars represent scoring for matched samples, and filled bars represent unmatched samples. Cancerous tissue samples are left of the red medial vertical line, and healthy tissue samples are on the right.
Fig. 4.
Fig. 4.
Staining for lamin A/C and RALBP1 in ovarian tissue sections. (Magnification: ×40.) Note intense staining of epithelial cells (long arrows) for RALBP1 and low staining of stromal cells (short arrows). Lamin A/C is found in epithelial as well as in stromal cells.
Fig. 5.
Fig. 5.
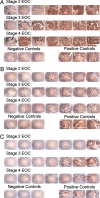
Tissue microarray analysis of different-stage ovarian tumor tissue. Microarrays containing representative tissue from stage II, stage III, and stage IV tumors were probed for lamin A/C (A), SSRP1 (B), and CA-125 (C). Staining of positive and negative control samples was performed in a separate parallel experiment. Representative images are shown. Total tissue samples for each stage: stage II, 7; stage III, 24; stage IV, 13. Complete sets of tissue staining images can be found in SI Figs. 7–10.
Fig. 6.
Fig. 6.
Candidate protein antigen distribution in other healthy and diseased tissues, probing for lamin A/C (A), SSRP1 (B), and RALBP1 (C). Three samples were analyzed for each tissue and disease state. Representative images are shown. Full sets of images are in SI Figs. 7–10.

References

    1. Jemal A, Siegel R, Ward E, Murray T, Xu J, Smigal C, Thun M. CA Cancer J Clin. 2006;56:106–130. - PubMed
    1. Gatta G, Lasota M, Verdecchia A. Eur J Cancer. 1998;34:2218–2225. - PubMed
    1. Skates S, Horick N, Yu Y, Xu F, Berchuck A, Havrilesky L, de Bruijn H, van der Zee A, Woolas R, Jacobs I, et al. J Clin Oncol. 2004;22:4059–4066. - PubMed
    1. Bast R, Jr, Klug T, St John E, Jenison E, Niloff J, Lazarus H, Berkowitz R, Leavitt T, Griffiths C, Parker L, et al. N Engl J Med. 1983;309:883–887. - PubMed
    1. Wang H, Kachman M, Schwartz D, Cho K, Lubman D. Proteomics. 2004;4:2476–2495. - PubMed

Publication types

MeSH terms