. 2007 Oct 30;104(44):17441-6.
doi: 10.1073/pnas.0708559104. Epub 2007 Oct 22.

Variation in HIV-1 set-point viral load: epidemiological analysis and an evolutionary hypothesis

Affiliations

Variation in HIV-1 set-point viral load: epidemiological analysis and an evolutionary hypothesis

Christophe Fraser et al. Proc Natl Acad Sci U S A. .

Abstract

The natural course of HIV-1 infection is characterized by a high degree of heterogeneity in viral load, not just within patients over time, but also between patients, especially during the asymptomatic stage of infection. Asymptomatic, or set-point, viral load has been shown to correlate with both decreased time to AIDS and increased infectiousness. The aim of this study is to characterize the epidemiological impact of heterogeneity in set-point viral load. By analyzing two cohorts of untreated patients, we quantify the relationships between both viral load and infectiousness and the duration of the asymptomatic infectious period. We find that, because both the duration of infection and infectiousness determine the opportunities for the virus to be transmitted, this suggests a trade-off between these contributions to the overall transmission potential. Some public health implications of variation in set-point viral load are discussed. We observe that set-point viral loads are clustered around those that maximize the transmission potential, and this leads us to hypothesize that HIV-1 could have evolved to optimize its transmissibility, a form of adaptation to the human host population. We discuss how this evolutionary hypothesis can be tested, review the evidence available to date, and highlight directions for future research.


Conflict of interest statement

The authors declare no conflict of interest.

Figures

Fig. 1.
Fig. 1.
The distribution of set-point viral loads. The distribution of viral loads (copies per milliliter of peripheral blood) is plotted for untreated individuals in the Amsterdam Seroconverters Cohort (black bars) and the Zambian Transmission Study (7) (gray bars). The bars represent bins 0.5 log10 wide and are labeled by their midpoint viral load.
Fig. 2.
Fig. 2.
Set-point viral load and duration of asymptomatic infection. The mean duration, in years, of the asymptomatic stage of infection is estimated as a function of viral load. (A) Best-fit and 95% confidence interval estimates are shown. (B) To ascertain the goodness of fit, Kaplan–Meier survival plots for the asymptomatic period are shown for patients grouped into quartiles of viral load (jagged lines, with crosses showing censored patients), along with model predictions (smooth lines).
Fig. 3.
Fig. 3.
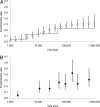
Set-point viral load and infectiousness. The transmission rate per year within a stable discordant partnership is estimated as a function of viral load. (A) Best-fit and 95% confidence interval estimates of the transmission rate based on a parametric model fitted to the data of ref. . The data from the Rakai study (6) are shown for comparison (dashed line). (B) We also plot the transmission rate as a function of the geometric mean viral load for subjects grouped into ascending octiles of viral load for these data. This shows strong evidence for saturation of the transmission rate at high viral loads.
Fig. 4.
Fig. 4.
Transmission potential. The transmission potential is defined as the expected number of people one case could infect over the whole course of asymptomatic infection, based on random contacts with susceptible individuals. It is the product of the transmission rate and the mean duration of the asymptomatic period (Figs. 2A and 3B) and is shown plotted with 95% confidence intervals as a function of viral load.
Fig. 5.
Fig. 5.
Optimal viral loads in a simple transmission model. The basic reproduction number R0 (solid line) and the initial epidemic exponential growth rate (dashed line) are estimated as functions of the mean set-point viral load of a hypothetical viral “strain.” The viral load values that maximize these quantities are shown as arrows, whereas the observed mean viral loads for the cohorts are shown as circles (open for Zambia and filled for Amsterdam Seroconverters).

References

    1. Hockett R, Kilby J, Derdeyn C, Saag M, Sillers M, Squires K, Chiz S, Nowak M, Shaw G, Bucy R. J Exp Med. 1999;189:1545–1554. - PMC - PubMed
    1. Coombs RW, Reichelderfer PS, Landay AL. AIDS. 2003;17:455–480. - PubMed
    1. Ball SC, Abraha A, Collins KR, Marozsan AJ, Baird H, Quinones-Mateu ME, Penn-Nicholson A, Murray M, Richard N, Lobritz M, et al. J Virol. 2003;77:1021–1038. - PMC - PubMed
    1. Mellors J, Rinaldo C, Gupta P, White R, Todd J, Kingsley L. Science. 1996;272:1167–1170. - PubMed
    1. de Wolf F, Spijkerman I, Schellekens PT, Langendam M, Kuiken C, Bakker M, Roos M, Coutinho R, Miedema F, Goudsmit J. AIDS. 1997;11:1799–1806. - PubMed

Publication types