. 2007 Oct 30;104(44):17394-9.
doi: 10.1073/pnas.0704998104. Epub 2007 Oct 22.

Molecular imaging of membrane interfaces reveals mode of beta-glucosidase activation by saposin C

Affiliations

Molecular imaging of membrane interfaces reveals mode of beta-glucosidase activation by saposin C

Jean-René Alattia et al. Proc Natl Acad Sci U S A. .

Abstract

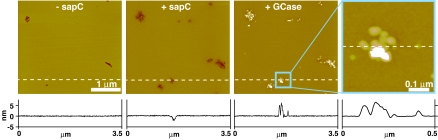
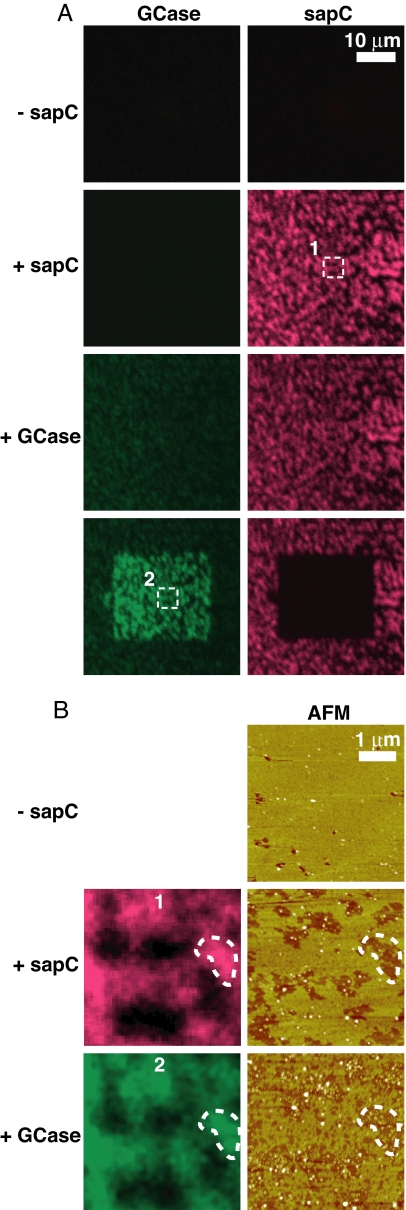
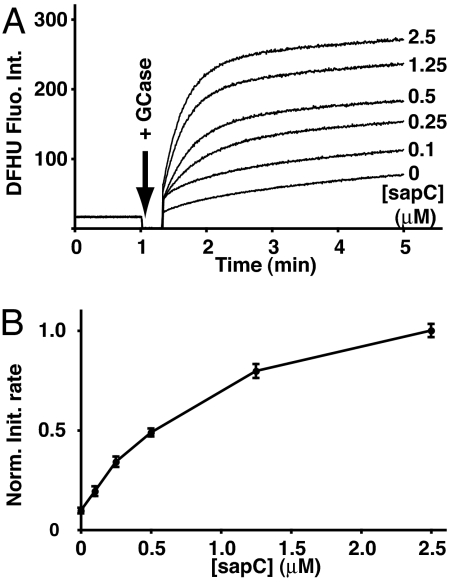
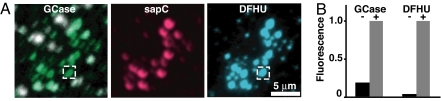
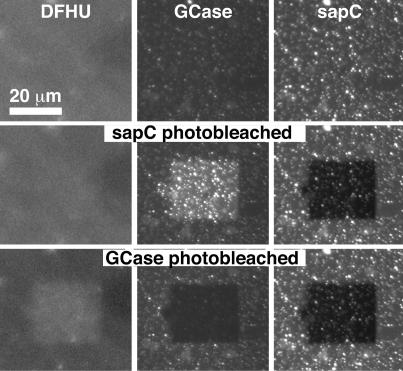
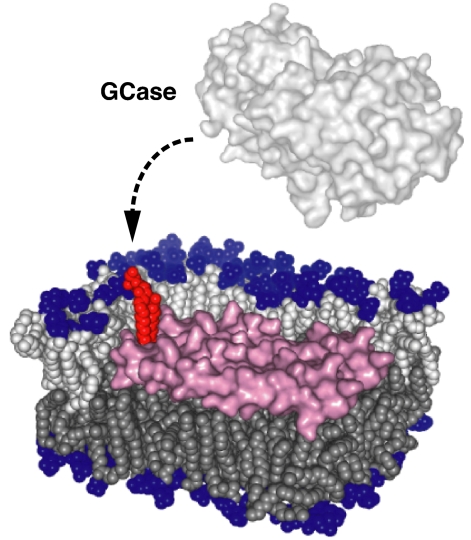
Acid beta-glucosidase (GCase) is a soluble lysosomal enzyme responsible for the hydrolysis of glucose from glucosylceramide and requires activation by the small nonenzymatic protein saposin C (sapC) to gain access to the membrane-embedded glycosphingolipid substrate. We have used in situ atomic force microscopy (AFM) with simultaneous confocal and epifluorescence microscopies to investigate the interactions of GCase and sapC with lipid bilayers. GCase binds to sites on membranes transformed by sapC, and enzyme activity occurs at loci containing both GCase and sapC. Using FRET, we establish the presence of GCase/sapC and GCase/product contacts in the bilayer. These data support a mechanism in which sapC locally alters regions of bilayer for subsequent attack by the enzyme in stably bound protein complexes.


Conflict of interest statement

The authors declare no conflict of interest.

Figures

Fig. 1.
Fig. 1.
AFM imaging of sapC and GCase interactions with a supported planar bilayer. The series of height images were acquired after the sequential addition of sapC (0.2 μM) and A488-GCase (0.07 μM), as labeled. The images depict the equilibrium state of the bilayer at the end of an evolution period after protein addition. The rightmost frame is a higher-resolution image of the GCase-affected area marked by the cyan box in the lower-resolution frame. The lateral XY scale of the images is given by the thick white bars. Pseudocolors are used to represent the height data, with darker areas corresponding to lower features. The height profiles corresponding to the dashed lines are all plotted with the same vertical scale.
Fig. 2.
Fig. 2.
Binding of labeled GCase to lipid bilayers remodeled by sapC. (A) The first three rows of confocal microscopy images correspond to the sequential addition to a supported planar bilayer (−sapC) of 0.5 μM A546-sapC (+sapC) and 0.05 μM A488-GCase (+Gcase). Left and Right images are, respectively, A488-GCase (green) and A546-sapC (red) channel images of the same bilayer area. (Bottom) After A546-sapC and A488-GCase addition, A546-sapC (FRET acceptor) was photobleached within a 25 × 25-μm square using intense 546-nm HeNe laser illumination (Bottom Right), resulting in an increase in FRET donor A488-GCase fluorescence in the area corresponding to photobleached A546-sapC (Bottom Left). (B) The confocal images labeled 1 and 2 are magnifications of the respective areas enclosed in dashed boxes in A. Tapping mode AFM height images of the corresponding area are given in Right. The AFM height image before protein addition is given in Top. Pseudocolors are used to represent the AFM height data, with darker areas corresponding to lower features. Image scales are given by white bars in each image.
Fig. 3.
Fig. 3.
GCase activity assay using the liposome-anchored DFUG substrate. (A) Kinetics of DFHU accumulation after addition of 0.05 μM GCase to liposomes preincubated with 0, 0.1, 0.25, 0.5, 1.25, and 2.5 μM sapC, as indicated. The total lipid concentration in each reaction was 100 μM, including 10 mol % DFUG. Reaction product DFHU fluorescence intensities are given in arbitrary units. The arrow indicates the time at which the enzyme was added to each sample, before mixing and the resumption of fluorescence measurements. (B) Dependence of the GCase initial reaction rates on sapC concentration. The rates were determined from the kinetics in A and normalized relative to the highest rate. Error bars correspond to ±3 standard deviations.
Fig. 4.
Fig. 4.
sapC-induced GCase binding and activation. (A) Pseudocolor fluorescence images of a lipid bilayer after consecutive additions of 0.1 μM A488-GCase and 5 μM sapC containing 10% A546-sapC. (Left) Overlay of A488-GCase confocal images before and after sapC addition to the bilayer (SI Fig. 8), showing newly accumulated A488-GCase after sapC addition (green areas) and the original areas of GCase accumulation before adding sapC (white patches). The A546-sapC confocal image (Center) and reaction product DFHU epifluorescence image (Right) of the same area show fluorescence localizations matching the newly accumulated A488-GCase fluorescence (Left). (B) Localized A488-GCase and enzyme product (DFHU) fluorescence intensities before (−) and after (+) sapC addition to the bilayer. Fluorescence intensities were quantified from the dashed box areas and normalized relative to the + intensity in each channel. The areas correspond to the position of a sapC-induced GCase spot. The images from which the pre-sapC intensities were quantified are not shown.
Fig. 5.
Fig. 5.
Sequential A546-sapC/A488-GCase and A488-GCase/DFHU FRET. (Top) Epifluorescence DFHU (Left) and confocal A488-GCase (Center) and A546-sapC (Right) images of a lipid bilayer after simultaneous exposure to 0.1 μM A488-GCase and 1 μM sapC containing 50% A546-sapC. (Top) Images before any photobleaching. (Middle) A546-sapC was photobleached within a 25 μm x 25 μm square using intense 543 nm HeNe laser illumination (Right). (Bottom) A488-GCase was then photobleached within a 25 × 25-μm square using intense Ar-ion 488 nm laser illumination (Center). Conditions were chosen to achieve extensive bilayer coverage with sapC and GCase. At this resolution, the sapC and GCase coverage appears relatively uniform. (The bright spots correspond to aggregates of sapC and GCase as seen in Fig. 1 and were confirmed by AFM scans of the same area.) DFUG hydrolysis occurs predominantly in the areas of uniform GCase/sapC coverage.
Fig. 6.
Fig. 6.
Schematic model for GCase binding to the membrane and saposin-mediated activation. GCase alone cannot extract membrane-embedded Glc-Cer from the bilayer. Saposin can help expose embedded lipids, including GlcCer (red), to soluble GCase molecules by creating perturbed edges between lowered and intact areas of the bilayer. Saposin molecules are colored in purple; lipid polar groups are blue. Acyl chains belonging to upper and lower leaflets are colored in light and dark gray, respectively.

References

    1. Futerman AH, van Meer G. Nat Rev Mol Cell Biol. 2004;5:554–565. - PubMed
    1. Kolter T, Sandhoff K. Annu Rev Cell Dev Biol. 2005;21:81–103. - PubMed
    1. Grabowski GA, Barton NW, Pastores G, Dambrosia JM, Banerjee TK, McKee MA, Parker C, Schiffmann R, Hill SC, Brady RO. Ann Intern Med. 1995;122:33–39. - PubMed
    1. Sandhoff K, Kolter T. Trends Cell Biol. 1996;6:98–103. - PubMed
    1. Vaccaro AM, Salvioli R, Tatti M, Ciaffoni F. Neurochem Res. 1999;24:307–314. - PubMed

Publication types