. 2007 Oct 23:2:24.
doi: 10.1186/1745-6150-2-24.

Evolution of the genetic code: partial optimization of a random code for robustness to translation error in a rugged fitness landscape

Affiliations

Evolution of the genetic code: partial optimization of a random code for robustness to translation error in a rugged fitness landscape

Artem S Novozhilov et al. Biol Direct. .

Abstract

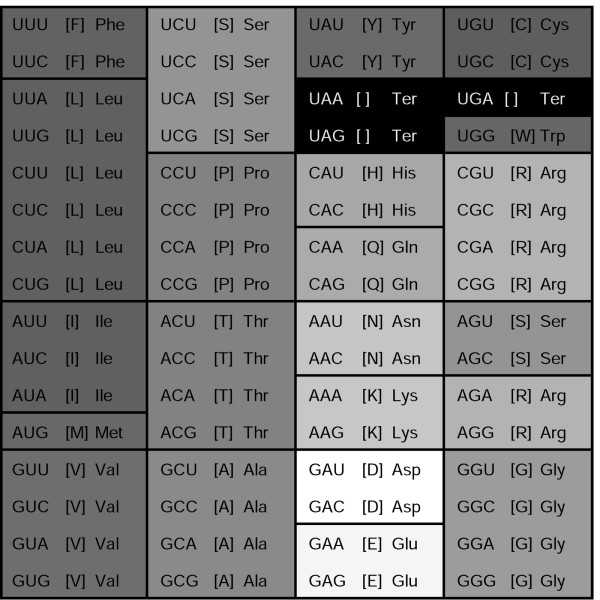
Background: The standard genetic code table has a distinctly non-random structure, with similar amino acids often encoded by codons series that differ by a single nucleotide substitution, typically, in the third or the first position of the codon. It has been repeatedly argued that this structure of the code results from selective optimization for robustness to translation errors such that translational misreading has the minimal adverse effect. Indeed, it has been shown in several studies that the standard code is more robust than a substantial majority of random codes. However, it remains unclear how much evolution the standard code underwent, what is the level of optimization, and what is the likely starting point.

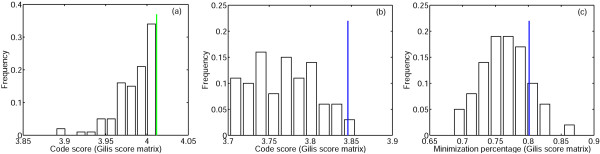
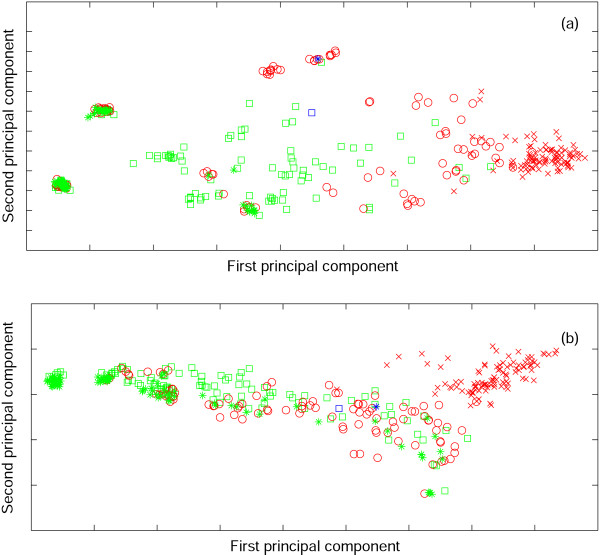
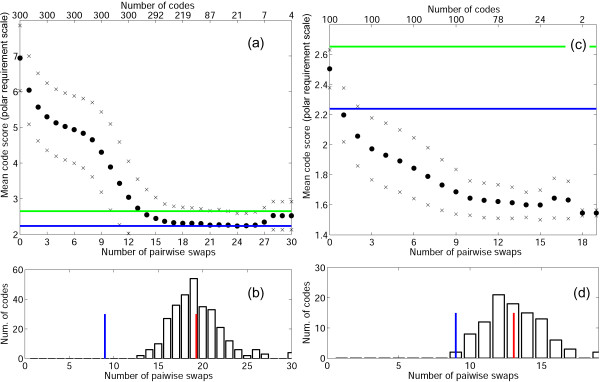
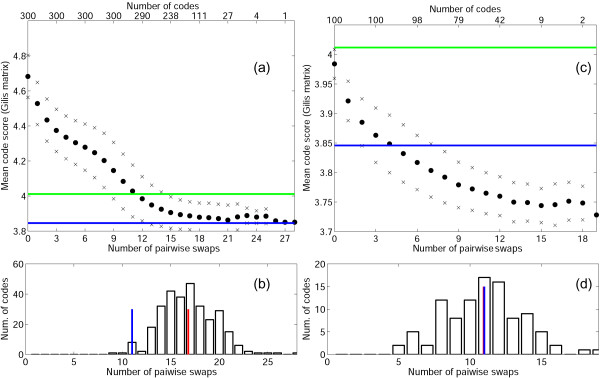
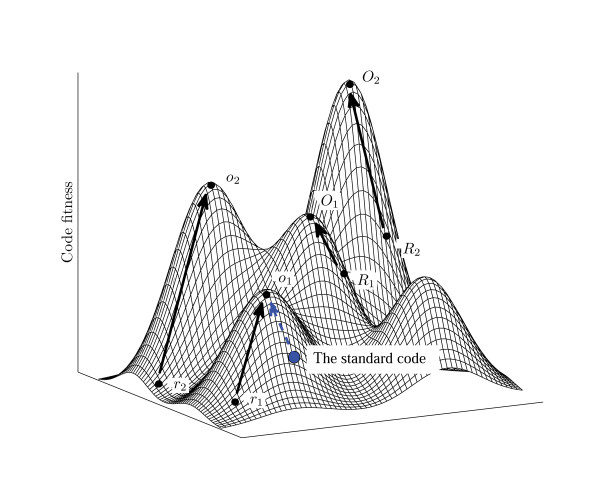
Results: We explored possible evolutionary trajectories of the genetic code within a limited domain of the vast space of possible codes. Only those codes were analyzed for robustness to translation error that possess the same block structure and the same degree of degeneracy as the standard code. This choice of a small part of the vast space of possible codes is based on the notion that the block structure of the standard code is a consequence of the structure of the complex between the cognate tRNA and the codon in mRNA where the third base of the codon plays a minimum role as a specificity determinant. Within this part of the fitness landscape, a simple evolutionary algorithm, with elementary evolutionary steps comprising swaps of four-codon or two-codon series, was employed to investigate the optimization of codes for the maximum attainable robustness. The properties of the standard code were compared to the properties of four sets of codes, namely, purely random codes, random codes that are more robust than the standard code, and two sets of codes that resulted from optimization of the first two sets. The comparison of these sets of codes with the standard code and its locally optimized version showed that, on average, optimization of random codes yielded evolutionary trajectories that converged at the same level of robustness to translation errors as the optimization path of the standard code; however, the standard code required considerably fewer steps to reach that level than an average random code. When evolution starts from random codes whose fitness is comparable to that of the standard code, they typically reach much higher level of optimization than the standard code, i.e., the standard code is much closer to its local minimum (fitness peak) than most of the random codes with similar levels of robustness. Thus, the standard genetic code appears to be a point on an evolutionary trajectory from a random point (code) about half the way to the summit of the local peak. The fitness landscape of code evolution appears to be extremely rugged, containing numerous peaks with a broad distribution of heights, and the standard code is relatively unremarkable, being located on the slope of a moderate-height peak.

Conclusion: The standard code appears to be the result of partial optimization of a random code for robustness to errors of translation. The reason the code is not fully optimized could be the trade-off between the beneficial effect of increasing robustness to translation errors and the deleterious effect of codon series reassignment that becomes increasingly severe with growing complexity of the evolving system. Thus, evolution of the code can be represented as a combination of adaptation and frozen accident.


Figures

Figure 1
Figure 1
The standard genetic code. The codon series are shaded in accordance with the PRS (Polar Requirement Scale) values [6], which is a measure of an amino acid's hydrophobicity: the greater hydrophobicity the darker the shading.
Figure 2
Figure 2
Comparison of the standard code with random alternatives for different amino acid substitution matrices and cost functions (1). Z-score is the distance, measured in standard deviations, between the mean of random code costs and the standard code cost. ϕ1, ϕ2, ϕ3 are the cost functions (1) where f(c) is the frequency of codon c; ϕ4, ϕ5, ϕ6 are the cost functions (1) for f(c) = 1 ϕ7, ϕ8, ϕ9;are the cost functions (1) where f(c) is the respective amino acid frequency; in ϕ1, ϕ4, ϕ7 p(c'|c) = 1 for any c and c' that differ by 1 nucleotide, and p(c'|c) = 0 otherwise; ϕ2, ϕ5, ϕ8 incorporate the inferred transition-transversion bias, i.e., p(c'|c) = trb if c and c' differ by a transition, and p(c'|c) = 1 if cand c' differ by a transversion (trb = 2 in our calculations); ϕ3, ϕ6, ϕ9 use the scheme (2).
Figure 3
Figure 3
Distribution of code scores (set o) obtained as a result of optimization of random codes. The green line is the cost of the standard code, the blue line is the cost of the code which was obtained by minimization of the standard code, the red line is the mean of the distribution. (a)PRS; (b)Gilis matrix.
Figure 4
Figure 4
The results of optimization of the random codes with cost values lower than the cost of the standard code (set R). The PRS was used as the measure of amino acid substitution cost. (a) Distribution of the code scores from R; the green line is the cost of the standard code; (b) Distribution of the scores for the codes obtained by optimization of the codes from R (set O), the blue line is the cost of the code obtained by optimization of the standard code; (c) Minimization percentage of the codes from O (see text for details); the blue line is the minimization percentage of the standard code.
Figure 5
Figure 5
The results of optimization of the random codes with cost values lower than the cost of the standard code (set R). The Gillis matrix was used as the measure of amino acid substitution cost. (a) Distribution of the code scores from R; the green line is the cost of the standard code; (b) Distribution of the scores for the codes obtained by optimization of the codes from R (set O), the blue line is the cost of the code obtained by optimization of the standard code; (c) Minimization percentage of the codes from O (see text for details); the blue line is the minimization percentage of the standard code.
Figure 6
Figure 6
Projection of the code maps onto the plane of the first two principal components (see text for details). Red 'x' signs, random codes, r; red circles, codes resulting from optimization of random codes, o; green squares, random codes that perform better than the standard code, R; green asterisks, codes resulting from optimization of the set R, O; blue square, the standard code; blue asterisk, the code resulting from the optimization of the standard code. (a) PRS; (b) the Gilis matrix.
Figure 7
Figure 7
Evolutionary dynamics of mean code scores in the course of minimization using the PRS as the measure of amino acid substitution cost. (a) The black circles show the mean score of the evolving random codes in the course of minimization vs arbitrary time units (pairwise swaps). Crosses show the mean values ± one standard deviation. The green line shows the cost of the standard code, and the blue shows the cost of the code that was obtained by minimization of the standard one. The top x-axis is the number of codes that did not reach their local minimum at the preceding step (starting from 300 random codes). The evolution of each code was followed until the code could not be improved anymore. (b) The number of codes that need exactly k pairwise swaps to reach minimum vs k; the blue line is the number of steps for the standard code to reach its local fitness peak (9); the red line is the mean of the distribution (19). (c) Same as (a) but the search started with 100 random codes that outperform the standard code. (d) Same as (b) but the search started with 100 random codes that outperform the standard code.
Figure 8
Figure 8
Evolutionary dynamics of mean code scores in the course of minimization using the Gillis matrix as the measure of amino acid substitution cost. (a) The black circles show the mean score of the evolving random codes in the course of minimization vs arbitrary time units (pairwise swaps). Crosses show the mean values ± one standard deviation. The green line shows the cost of the standard code, and the blue shows the cost of the code that was obtained by minimization of the standard one. The top x-axis is the number of codes that did not reach their local minimum at the preceding step (starting from 300 random codes). The evolution of each code was followed until the code could not be improved anymore. (b) the number of codes that need exactly k pairwise swaps to reach minimum vs k; the blue line is the number of steps for the standard code to reach its local fitness peak (9); the red line is the mean of the distribution (19); (c) Same as (a) but the search started with 100 random codes that outperform the standard code; (d) Same as (b) but the search started with 100 random codes that outperform the standard code.
Figure 9
Figure 9
Evolution of codes in a rugged fitness landscape (a cartoon illustration).r1, r2 r: random codes with the same block structure as the standard code. o1, o2 o: codes obtained from r1, r2 r: after optimization. R1, R2 R: random codes with fitness values greater than the fitness of the standard code. O1, O2 O: codes obtained from R1, R2 R: after optimization.

References

    1. Nirenberg MW, Jones W, Leder P, Clark BFC, Sly WS, Pestka S. On the Coding of Genetic Information. Cold Spring Harb Symp Quant Biol. 1963;28:549–558.
    1. Crick FH. Codon--anticodon pairing: the wobble hypothesis. J Mol Biol. 1966;19:548–555. - PubMed
    1. Crick FH. The origin of the genetic code. J Mol Biol. 1968;38:367–379. doi: 10.1016/0022-2836(68)90392-6. - DOI - PubMed
    1. Woese C. The genetic code: the molecular basis for genetic expression. New York , Harper & Row; 1967.
    1. Ambrogelly A, Palioura S, Soll D. Natural expansion of the genetic code. Nat Chem Biol. 2007;3:29–35. doi: 10.1038/nchembio847. - DOI - PubMed

Publication types

LinkOut - more resources