. 2007 Oct 30;104(44):17255-60.
doi: 10.1073/pnas.0708669104. Epub 2007 Oct 23.

Confocal light absorption and scattering spectroscopic microscopy monitors organelles in live cells with no exogenous labels

Affiliations

Confocal light absorption and scattering spectroscopic microscopy monitors organelles in live cells with no exogenous labels

Irving Itzkan et al. Proc Natl Acad Sci U S A. .

Abstract

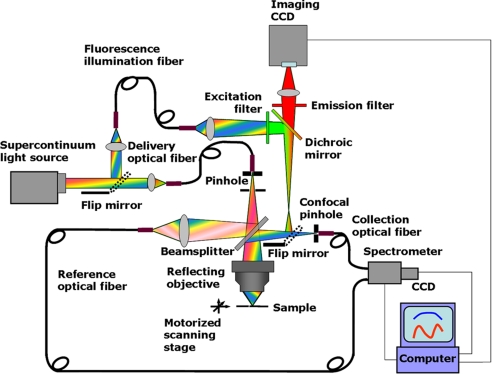
This article reports the development of an optical imaging technique, confocal light absorption and scattering spectroscopic (CLASS) microscopy, capable of noninvasively determining the dimensions and other physical properties of single subcellular organelles. CLASS microscopy combines the principles of light-scattering spectroscopy (LSS) with confocal microscopy. LSS is an optical technique that relates the spectroscopic properties of light elastically scattered by small particles to their size, refractive index, and shape. The multispectral nature of LSS enables it to measure internal cell structures much smaller than the diffraction limit without damaging the cell or requiring exogenous markers, which could affect cell function. Scanning the confocal volume across the sample creates an image. CLASS microscopy approaches the accuracy of electron microscopy but is nondestructive and does not require the contrast agents common to optical microscopy. It provides unique capabilities to study functions of viable cells, which are beyond the capabilities of other techniques.


Conflict of interest statement

The authors declare no conflict of interest.

Figures

Fig. 1.
Fig. 1.
Comparison of the size distributions obtained with TEM and CLASS microscopy. (A) TEM photograph of the fraction containing microsomes taken with a magnification of 46,000. (B) Comparison of the size distributions of the corresponding fraction obtained with TEM (red line) and CLASS microscopy (blue line).
Fig. 2.
Fig. 2.
The CLASS spectra for two individual organelles inside the live 16HBE14o− human bronchial epithelial cell. (A Left) The spectra show oscillations with periodicity related to the sizes of the organelle in the confocal volume. The dotted lines are data and the solid lines are best fits using the model. (A Right) Reconstructed cross-sectional image of the cell. The image is reconstructed from the CLASS microscope spectra. The diameters of the spheres in the image represent the reconstructed sizes of the individual organelles, and the grayscale represents their refractive index. Individual organelles can easily be seen inside the cell. (B) The reconstructed images of three untreated human bronchial epithelial cells (upper row) and three similar cells treated with DHA that are undergoing apoptosis (lower row). In the apoptotic cells, the organelles form shell-like structures with an empty space in the middle. The treated and untreated cells show clear differences in organelle spatial distribution.
Fig. 3.
Fig. 3.
Simultaneous CLASS and fluorescence imaging of microspheres and live cells. (A) Fluorescence image of the suspensions of carboxylate-modified 1.9-μm-diameter microspheres exhibiting red fluorescence (Left), the image reconstructed from the CLASS data (Center), and the overlay of the images (Right). (B) Image of the mixture of three sizes of fluorescent beads with sizes 0.5 μm, 1.1 μm, and 1.9 μm mixed in a ratio of 4:2:1 (Left), the image reconstructed from the CLASS data (Center), and the overlay of the images (Right). (C) Image of live 16HBE14o− human bronchial epithelial cells with lysosomes stained with lysosome-specific fluorescence dye (Left), the image reconstructed from the CLASS data (Center), and the overlay of the images (Right).
Fig. 4.
Fig. 4.
The time sequence of CLASS microscope reconstructed images of a single cell. The cell was treated with DHA and incubated for 21 h. The time indicated in each image is the time elapsed after the cell was removed from the incubator.
Fig. 5.
Fig. 5.
Schematic of the prototype CLASS/fluorescence microscope.
Fig. 6.
Fig. 6.
Depth sectioning of CLASS microscope along vertical axis at five different wavelengths (500 nm, 550 nm, 600 nm, 650 nm, and 700 nm). The almost identical nature of the spectra demonstrates the very good chromatic characteristics of the instrument.

References

    1. Perelman LT, Backman V, Wallace M, Zonios G, Manoharan R, Nusrat A, Shields S, Seiler M, Lima C, Hamano T, et al. Phys Rev Lett. 1998;80:627–630.
    1. Backman V, Wallace MB, Perelman LT, Arendt JT, Gurjar R, Müller MG, Zhang Q, Zonios G, Kline E, McGillican T, et al. Nature. 2000;406:35–36. - PubMed
    1. Gurjar RS, Backman V, Perelman LT, Georgakoudi I, Badizadegan K, Itzkan I, Dasari RR, Feld MS. Nat Med. 2001;7:1245–1248. - PubMed
    1. Perelman LT, Backman V. In: Handbook on Optical Biomedical Diagnostics. Tuchin V, editor. Bellingham: SPIE Press; 2002. pp. 675–724.
    1. Backman V, Gopal V, Kalashnikov M, Badizadegan K, Gurjar R, Wax A, Georgakoudi I, Mueller M, Boone CW, Dasari RR, Feld MS. IEEE J Sel Top Quant Elect. 2001;7:887–894.

Publication types

LinkOut - more resources