

Dysconnection topography in schizophrenia revealed with state-space analysis of EEG
- PMID: 17957243
- PMCID: PMC2020441
- DOI: 10.1371/journal.pone.0001059
Dysconnection topography in schizophrenia revealed with state-space analysis of EEG
Abstract
Background: The dysconnection hypothesis has been proposed to account for pathophysiological mechanisms underlying schizophrenia. Widespread structural changes suggesting abnormal connectivity in schizophrenia have been imaged. A functional counterpart of the structural maps would be the EEG synchronization maps. However, due to the limits of currently used bivariate methods, functional correlates of dysconnection are limited to the isolated measurements of synchronization between preselected pairs of EEG signals.
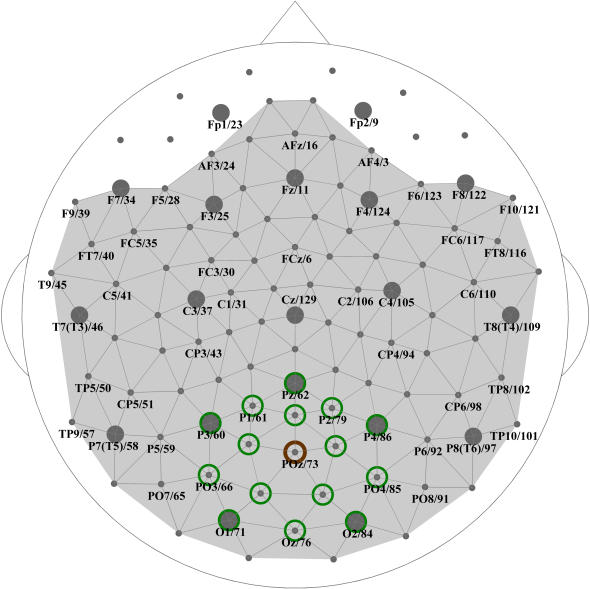
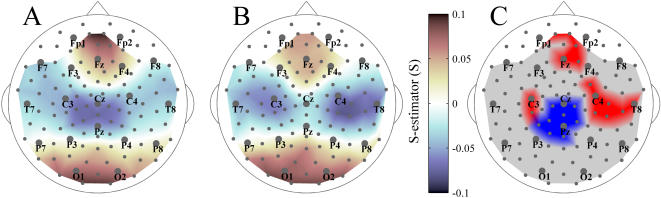
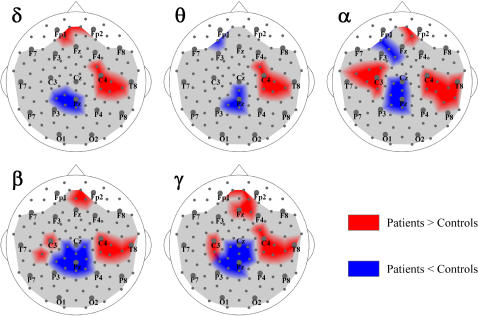
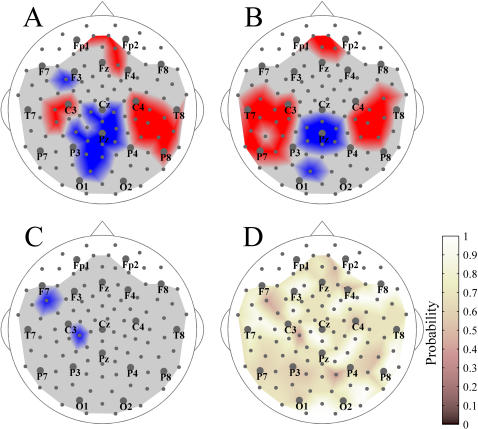
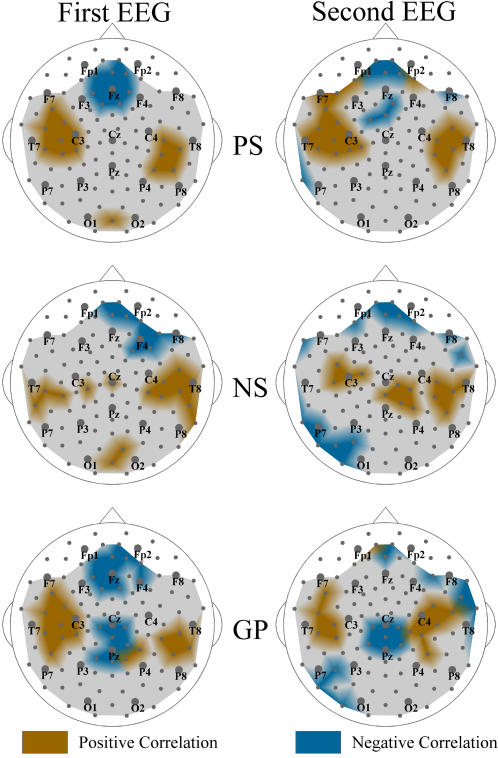
Methods/results: To reveal a whole-head synchronization topography in schizophrenia, we applied a new method of multivariate synchronization analysis called S-estimator to the resting dense-array (128 channels) EEG obtained from 14 patients and 14 controls. This method determines synchronization from the embedding dimension in a state-space domain based on the theoretical consequence of the cooperative behavior of simultaneous time series-the shrinking of the state-space embedding dimension. The S-estimator imaging revealed a specific synchronization landscape in schizophrenia patients. Its main features included bilaterally increased synchronization over temporal brain regions and decreased synchronization over the postcentral/parietal region neighboring the midline. The synchronization topography was stable over the course of several months and correlated with the severity of schizophrenia symptoms. In particular, direct correlations linked positive, negative, and general psychopathological symptoms to the hyper-synchronized temporal clusters over both hemispheres. Along with these correlations, general psychopathological symptoms inversely correlated within the hypo-synchronized postcentral midline region. While being similar to the structural maps of cortical changes in schizophrenia, the S-maps go beyond the topography limits, demonstrating a novel aspect of the abnormalities of functional cooperation: namely, regionally reduced or enhanced connectivity.
Conclusion/significance: The new method of multivariate synchronization significantly boosts the potential of EEG as an imaging technique compatible with other imaging modalities. Its application to schizophrenia research shows that schizophrenia can be explained within the concept of neural dysconnection across and within large-scale brain networks.
Conflict of interest statement
Figures
Similar articles
-
Brain functional connectivity and the pathophysiology of schizophrenia.Psychiatriki. 2014 Apr-Jun;25(2):91-4. Psychiatriki. 2014. PMID: 25035177 English, Greek, Modern.
-
EEG phase synchronization in patients with paranoid schizophrenia.Neurosci Lett. 2008 Dec 5;447(1):73-7. doi: 10.1016/j.neulet.2008.09.055. Epub 2008 Sep 26. Neurosci Lett. 2008. PMID: 18835328
-
Synchronization of EEG: bivariate and multivariate measures.IEEE Trans Neural Syst Rehabil Eng. 2014 Mar;22(2):212-21. doi: 10.1109/TNSRE.2013.2289899. IEEE Trans Neural Syst Rehabil Eng. 2014. PMID: 24216751
-
Brain neural synchronization and functional coupling in Alzheimer's disease as revealed by resting state EEG rhythms.Int J Psychophysiol. 2016 May;103:88-102. doi: 10.1016/j.ijpsycho.2015.02.008. Epub 2015 Feb 7. Int J Psychophysiol. 2016. PMID: 25660305 Review.
-
[On the study methods of electroencephalograph synchronization].Sheng Wu Yi Xue Gong Cheng Xue Za Zhi. 2009 Dec;26(6):1353-7. Sheng Wu Yi Xue Gong Cheng Xue Za Zhi. 2009. PMID: 20095502 Review. Chinese.
Cited by
-
Influence of the Number of Channels and Classification Algorithm on the Performance Robustness to Electrode Shift in Steady-State Visual Evoked Potential-Based Brain-Computer Interfaces.Front Neuroinform. 2021 Oct 22;15:750839. doi: 10.3389/fninf.2021.750839. eCollection 2021. Front Neuroinform. 2021. PMID: 34744677 Free PMC article.
-
Schneiderian first rank symptoms and gamma oscillatory activity in neuroleptic naïve first episode schizophrenia: a 192 channel EEG study.Psychiatry Investig. 2014 Oct;11(4):467-75. doi: 10.4306/pi.2014.11.4.467. Epub 2014 Oct 20. Psychiatry Investig. 2014. PMID: 25395979 Free PMC article.
-
Brain state-dependent abnormal LFP activity in the auditory cortex of a schizophrenia mouse model.Front Neurosci. 2014 Jul 1;8:168. doi: 10.3389/fnins.2014.00168. eCollection 2014. Front Neurosci. 2014. PMID: 25018691 Free PMC article.
-
Antipsychotics reverse abnormal EEG complexity in drug-naive schizophrenia: a multiscale entropy analysis.Neuroimage. 2010 May 15;51(1):173-82. doi: 10.1016/j.neuroimage.2010.02.009. Epub 2010 Feb 10. Neuroimage. 2010. PMID: 20149880 Free PMC article.
-
Glutathione precursor N-acetyl-cysteine modulates EEG synchronization in schizophrenia patients: a double-blind, randomized, placebo-controlled trial.PLoS One. 2012;7(2):e29341. doi: 10.1371/journal.pone.0029341. Epub 2012 Feb 22. PLoS One. 2012. PMID: 22383949 Free PMC article. Clinical Trial.
References
-
- Bleuler E. New York: International Universities Press; 1911. Dementia praecox or the group of schizophrenias. Zinkin J, translator.
-
- Woods BT. Is schizophrenia a progressive neurodevelopmental disorder? Toward a unitary pathogenetic mechanism. American Journal of Psychiatry. 1998;155:1661–1670. - PubMed
-
- Cotter D, Mackay D, Chana G, Beasley C, S SL, et al. Reduced neuronal size and glia cell density in area 9 of the dorsolateral prefrontal cortex in subjects with major depressive disorder. Cerebral Cortex. 2002;12:386–394. - PubMed
-
- Pakkenberg B. Post-mortem study of chronic schizophrenic brains. British Journal of Psychiatry. 1987;151:744–752. - PubMed
-
- Selemon LD, Rajkowska G, Goldman-Rakic PS. Abnormally high neuronal density in the schizophrenia cortex-a morphometric analysis of prefrontal area-9 and occipital area-17. Archives of General Psychiatry. 1995;52:805–818. - PubMed
Publication types
MeSH terms
LinkOut - more resources
Full Text Sources
Medical
