. 2007 Oct 24;2(10):e1073.
doi: 10.1371/journal.pone.0001073.

High speed two-photon imaging of calcium dynamics in dendritic spines: consequences for spine calcium kinetics and buffer capacity

Affiliations

High speed two-photon imaging of calcium dynamics in dendritic spines: consequences for spine calcium kinetics and buffer capacity

L Niels Cornelisse et al. PLoS One. .

Abstract

Rapid calcium concentration changes in postsynaptic structures are crucial for synaptic plasticity. Thus far, the determinants of postsynaptic calcium dynamics have been studied predominantly based on the decay kinetics of calcium transients. Calcium rise times in spines in response to single action potentials (AP) are almost never measured due to technical limitations, but they could be crucial for synaptic plasticity. With high-speed, precisely-targeted, two-photon point imaging we measured both calcium rise and decay kinetics in spines and secondary dendrites in neocortical pyramidal neurons. We found that both rise and decay kinetics of changes in calcium-indicator fluorescence are about twice as fast in spines. During AP trains, spine calcium changes follow each AP, but not in dendrites. Apart from the higher surface-to-volume ratio (SVR), we observed that neocortical dendritic spines have a markedly smaller endogenous buffer capacity with respect to their parental dendrites. Calcium influx time course and calcium extrusion rate were both in the same range for spines and dendrites when fitted with a dynamic multi-compartment model that included calcium binding kinetics and diffusion. In a subsequent analysis we used this model to investigate which parameters are critical determinants in spine calcium dynamics. The model confirmed the experimental findings: a higher SVR is not sufficient by itself to explain the faster rise time kinetics in spines, but only when paired with a lower buffer capacity in spines. Simulations at zero calcium-dye conditions show that calmodulin is more efficiently activated in spines, which indicates that spine morphology and buffering conditions in neocortical spines favor synaptic plasticity.


Conflict of interest statement

Competing Interests: The authors have declared that no competing interests exist.

Figures

Figure 1
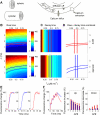
Figure 1. Fast two-photon imaging of calcium rise times in spines and dendrites.
A. Image of a targeted spine and dendrite. The laser was successively parked on the spine and dendrite at the sites indicated by the red and blue dot, respectively. B. Fluorescence decay time measurements following a single AP evoked in the soma (left panel) in a dendrite (blue) and spine (red; middle panel). Fluorescence traces were normalized to the peak to facilitate comparison of kinetics between spines and dendrites. White lines represent a mono-exponential fit to the fluorescence decay. Summary data for all fluorescence decay time measurements evoked by a single AP (n = 22 for both spines and dendrites, right panel). Time constants were obtained from mono-exponential fits to fluorescence during the decay phase * p<0.01. C. Same fluorescence changes and AP as in B (left panel), but on a smaller time scale to illustrate differences in rise times of dendrites and spines (middle panel). Traces were again normalized to facilitate comparison. Summary data of all fluorescence rise time measurements evoked by a single AP (n = 22 for both spines and dendrites, right panel) with time constants obtained from mono-exponential fits to fluorescence during the rising phase. *P<0.01. D. Fluorescence changes measured with two-photon point imaging from dendrites (blue) and spines (red) during AP trains. Lower panel: voltage traces with the AP trains induced in the soma. E. Summary data of fluorescence changes during AP trains. Left panel: step sizes induced by individual APs during the 50 Hz train (n = 9). Note that the step sizes continue to decrease in dendrites whereas they remain larger in spines. Right panel: fluorescence decreases after each AP in 50 Hz train. Dotted line indicates the average fluorescence increase induced by the last 3 APs in the train. The decreases in spines almost match these step increases.
Figure 2
Figure 2. Differing estimates of endogenous buffer capacities in spines and small dendrites.
A. Example image of a targeted dendrite and spine pair. Dotted line indicates line-scanned region. B. Back-propagating AP trains were induced to cause maximal dye-saturating calcium indicator fluorescence changes in both spines and dendrites to calculate fmax. Upper panel, AP train. Lower panels, example maximal fluorescence plateau levels. Darker line indicates boxplot smoothed trace average used for fmax calculations. C. Examples of average δf and δfmax signals following single AP and AP trains respectively, from spines and dendrites. Arrow indicates onset of stimulation. D. Inverse peak calcium change (Δ[Ca2+]AP −1) following a single AP versus added buffer capacity, κD, for dendrite (blue, upper panel) and spine (red, lower panel). Average values (mean±SEM) for each added buffer concentration (33, 50, 62.5, 75, 90, 100 µM) are plotted over individual data points (open circles) (n = 35). Endogenous buffer capacity (κE) was read off from the intersection of the linear fit with the x axis at zero level of added dye. [Spine κE = 19 UCI:40, LCI:4; Dendrite κE = 62 UCI:172, LCI:15). 95% confidence intervals are shown in dotted outlines.
Figure 3
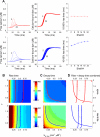
Figure 3. Dynamic modeling of rapid calcium signaling in spines and dendrites.
A. Schematic representation of the model components. Spines were modeled as a sphere, dendrites were modeled as a cylinder. Calcium entered and was removed from the outer shell only (shell number 0). Endogenous calcium buffer (B) was fixed while calcium, and calcium indicator dye (D) diffused freely among shells. B, C. Parameter space analysis for the model parameters σ (standard deviation of the Gaussian calcium influx) and γ0 (intrinsic extrusion rate). B. Color-coded plot of fluorescence 10% to 90% rise times as a function of σ and γ0 for spines (upper panel) and dendrites (lower panel). Simulations were performed for different combinations of σ and γ0 with all the other parameters set at their default value (Table 2). Total fluorescence was calculated from the relative contributions of all shells corrected for shell volume. 10–90% rise times were obtained from the total fluorescence signal and plotted in the parameter space for each simulation. Contours indicate the location of fluorescence rise time values obtained in point scan experiments for spines (red) and dendrites (blue) in the parameter space (spine: 3.0–3.4 ms; dendrite: 4.4–5.0 ms). C. Similar plots as in B for fluorescence decay times for spines (upper panel) and dendrites (lower panel). Decay times were fitted from the total fluorescence signal with a mono-exponential. Contours indicate experimental range of decay time constants for spines (red) and dendrites (blue) (spine: 80–100 ms; dendrite: 180–220 ms). Scale bars for color-coding show rise times (left scale) and decay times (right scale) in ms. C. Overlay of contour plots of rise times and decay times showing areas of overlap where the model fits both experimental rise and decay times in spines and dendrites correctly. From these areas the center co-ordinates were extracted for σ and γ0 for spines and dendrites that were used as default values in the other simulations in the paper (Table 2). E. Traces of AP-induced fluorescence changes in spines (red) and dendrites (blue) generated by the model plotted on top of representative experimental traces of AP-induced fluorescence changes in spines (middle panel) and dendrites (right panel). F. Traces of calcium bound dye in spines (red) and dendrites (blue) in response to a 50 Hz AP train of 5 APs cf Figure 2E. Quantification of fluorescence step sizes (middle panel) and fluorescence decreases after APs (right panel) during the AP train calculated by the model cf Figure 2F.
Figure 4
Figure 4. Diffusion cannot explain faster calcium dynamics in spines.
(A) Free calcium signals (left panel) and fluorescent signals (calcium bound to dye, middle panel) are plotted for different shells (shell 2, 6, 10, 14, 18, 22) in the multi-compartmental model for spines (upper panels) and dendrites (lower panels). Right panels show 10–90% rise times from the fluorescent signals in the middle panels. B. Parameter space analysis similar as in Figure 3 for model parameters f (diffusion factor) and kon,dye (binding rate of the calcium indicator). B. Color-coded plot of fluorescence 10% to 90% rise times for spines (upper panel) and dendrites (lower panel) with the contours indicating the experimental range for rise time values for spines (red) and dendrites (blue). Plus signs indicate default parameter values for spines (red) and dendrites (blue) as listed in Table 2. C. Similar plots as in B for fluorescence decay times for spines (upper panel) and dendrites (lower panel). Scale bars for color-coding show rise times (left scale) and decay times (right scale) in ms. D. Overlay of contour plots of rise times and decay times showing large areas of overlap where the model fits both experimental rise and decay times in spines and dendrites correctly.
Figure 5
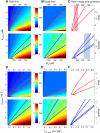
Figure 5. Effect of buffer parameters on calcium dynamics.
A–C. Parameter space analysis similar as in Figure 3 and 4 for model parameters KD,endo (dissociation constant for endogenous buffer) and Btot,endo (total concentration endogenous buffer). Plus signs indicate default parameter values for spines (red) and dendrites (blue) as listed in Table 2. C. Overlay of contour plots of rise times and decay times show areas of overlap where the model fits the experimental rise and decay times, with different ranges of Btot,endo for spines (transparent red bar) and dendrites (transparent blue bar). D–F Similar analysis for model parameters kon,endo (binding rate of the endogenous buffer) and koff, endo (unbinding rate of the endogenous buffer). F. Parameter ranges for kon,endo and koff, endo in spines and dendrites display a large overlap.
Figure 6
Figure 6. Effect of surface-to-volume ratio and buffer concentration on calcium dynamics.
A–C. Parameter space analysis as in Figures 3– 5 for model parameters SVR (surface-to-volume ratio) and Btot,endo (total endogenous buffer concentration). C. Parameter ranges for both SVR and Btot,endo differ between spines (red transparent bars) and dendrites (blue transparent bars).
Figure 7
Figure 7. Free calcium dynamics and calmodulin activation during single APs and AP trains.
A, B. Model calculations for free calcium dynamics during a single AP (left panels) and during a train of 5 APs at 50 Hz (right panels) in spines (A) and dendrites (B). Plotted are the free calcium concentration traces of shells 2, 6, 10, 14, 18 and 22. C. Calmodulin activation during a single AP and an AP train. Of the total endogenous buffer, 10 µM was assumed to be calmodulin in both dendrites and spines. Shown traces for calcium-bound calmodulin are the total calmodulin signals determined from the relative contributions of all shells corrected for shell volume. D. Parameter space analysis of the effect of model parameters SVR and Btot,endo on calmodulin activation in spines. Upper panels show 10–90% rise time and decay time of the calmodulin signal. Color bar indicates range for rise times (left scale) and decay times (right scale) in ms. Lower left panel shows calmodulin activation at the peak of the signal and lower right panel shows the total calmodulin activation defined as the integral of the calmodulin signal. Color bar indicates range for peak activation in µM (left scale) and total activation in µM ms (right scale). E. Effect of increasing concentrations of the mobile buffers parvalbumin or calbindin on free calcium dynamics in spines. These buffers were added on top of the endogenous buffer concentration. Traces are the average free calcium signals for different mobile buffer concentration obtained from the traces of all shells corrected for shell volume.

Similar articles

Cited by

References

    1. Yuste R, Denk W. Dendritic spines as basic functional units of neuronal integration. Nature. 1995;375:682–684. - PubMed
    1. Yuste R, Majewska A, Holthoff K. From form to function: calcium compartmentalization in dendritic spines. NatNeurosci. 2000;3:653–659. - PubMed
    1. Sabatini BL, Maravall M, Svoboda K. Ca(2+) signaling in dendritic spines. Curr Opin Neurobiol. 2001;11:349–356. - PubMed
    1. Zucker RS. Calcium- and activity-dependent synaptic plasticity. Curr Opin Neurobiol. 1999;9:305–313. - PubMed
    1. Yang SN, Tang YG, Zucker RS. Selective induction of LTP and LTD by postsynaptic [Ca2+]i elevation. J Neurophysiol. 1999;81:781–787. - PubMed

Publication types

LinkOut - more resources