. 2007 Dec 1;468(1):70-81.
doi: 10.1016/j.abb.2007.08.012. Epub 2007 Aug 25.

Mitochondrial P450-dependent arachidonic acid metabolism by TCDD-induced hepatic CYP1A5; conversion of EETs to DHETs by mitochondrial soluble epoxide hydrolase

Affiliations

Mitochondrial P450-dependent arachidonic acid metabolism by TCDD-induced hepatic CYP1A5; conversion of EETs to DHETs by mitochondrial soluble epoxide hydrolase

Erin M Labitzke et al. Arch Biochem Biophys. .

Abstract

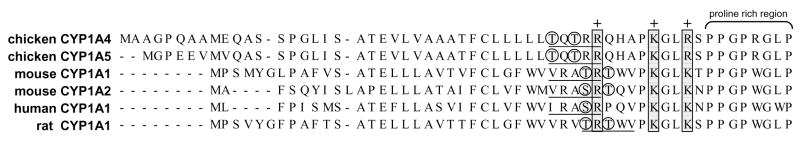
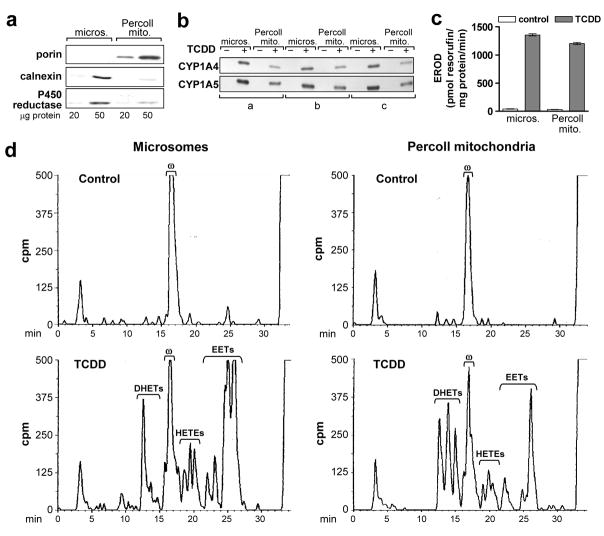
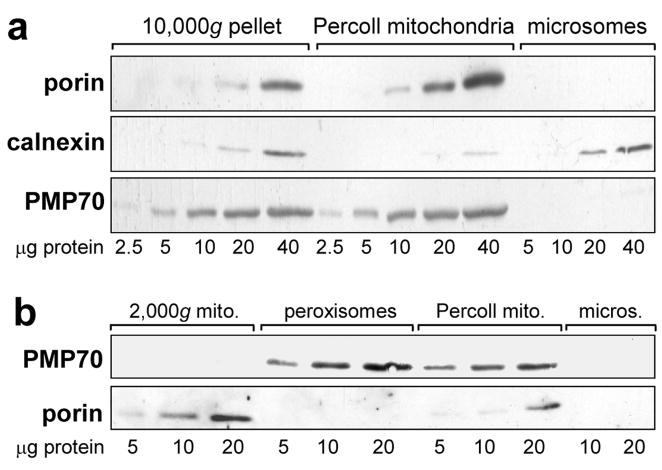
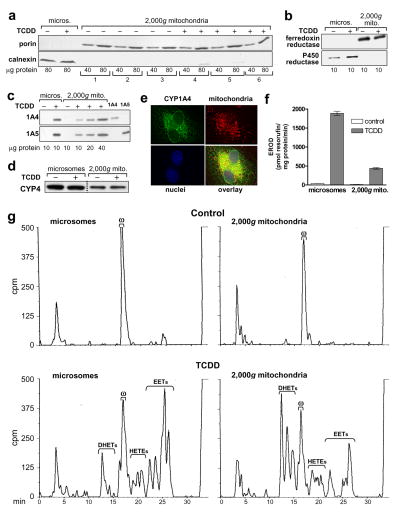
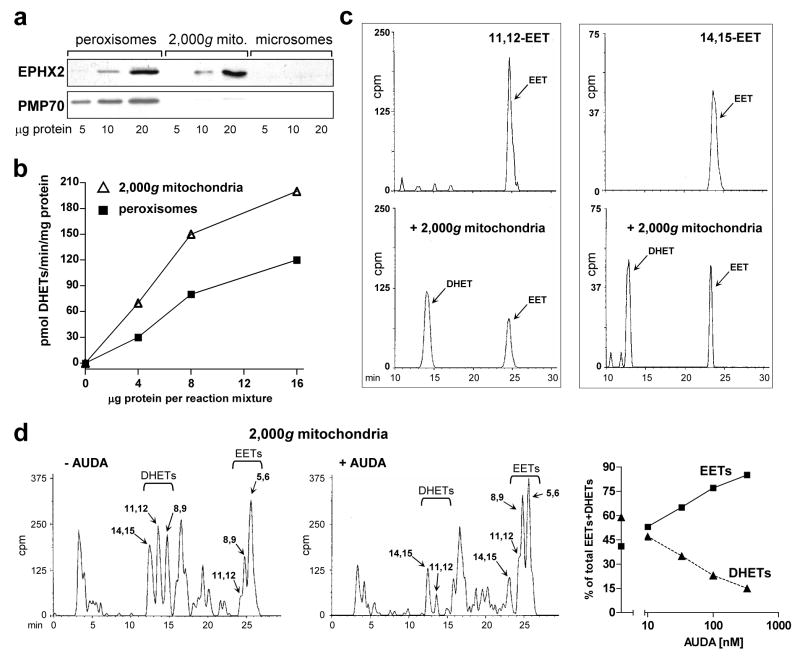
Several P450 enzymes localized in the endoplasmic reticulum and thought to be involved primarily in xenobiotic metabolism, including mouse and rat CYP1A1 and mouse CYP1A2, have also been found to translocate to mitochondria. We report here that the environmental toxin 2,3,7,8-tetrachlorodibenzo-p-dioxin (TCDD) induces enzymatically active CYP1A4/1A5, the avian orthologs of mammalian CYP1A1/1A2, in chick embryo liver mitochondria as well as in microsomes. P450 proteins and activity levels (CYP1A4-dependent 7-ethoxyresorufin-O-deethylase and CYP1A5-dependent arachidonic acid epoxygenation) in mitochondria were 23-40% of those in microsomes. DHET formation by mitochondria was twice that of microsomes and was attributable to a mitochondrial soluble epoxide hydrolase as confirmed by Western blotting with antiEPHX2, conversion by mitochondria of pure 11,12 and 14,15-EET to the corresponding DHETs and inhibition of DHET formation by the soluble epoxide hydrolase inhibitor, 12(-3-adamantan-1-yl-ureido)-dodecanoic acid (AUDA). TCDD also suppressed formation of mitochondrial and microsomal 20-HETE. The findings newly identify mitochondria as a site of P450-dependent arachidonic acid metabolism and as a potential target for TCDD effects. They also demonstrate that mitochondria contain soluble epoxide hydrolase and underscore a role for CYP1A in endobiotic metabolism.


Figures

Figure 1
Figure 1. Comparison of CYP1A N-terminal amino acid sequences: conserved mitochondrial targeting signals
N-terminal amino acid sequences of chicken CYP1A4 (accession #: NP_990478) and CYP1A5 (accession #: NP_990477), mouse CYP1A1 (accession #: NP_034122) and CYP1A2 (accession #: NP_034123), human CYP1A1 (accession #: NP_000490) and rat CYP1A1 (accession #: NP_036672) were aligned using DNASTAR software (ClustalW method). The three conserved positively charged amino acids indicated by the ‘+’ preceding the proline-rich hinge region that constitute the mitochondrial targeting signal are shown. Circles indicate putative phosphorylation sites; predicted cleavage sites are underlined.
Figure 2
Figure 2. TCDD induced CYP1A4 and 1A5 and associated enzyme activities in mitochondria isolated by Percoll density gradient centrifugation
Microsomes (micros.) and mitochondria (Percoll mito.) were prepared from livers of 17 day old CE 24 hr after treatment with TCDD at 1 nmol/egg or the solvent dioxane (control) (3 groups each for control and TCDD treated CE, 8 to 10 eggs per group). Mitochondria were isolated using a Percoll density gradient; microsomes were prepared from the same livers, concurrently, as described in “Materials and Methods”. a. Mitochondrial purity. Representative Western blot of Percoll mitochondria and microsomes from one of six groups using antibodies against porin (mitochondrial marker, 31 kDa), calnexin (ER marker, 78 kDa) and P450 reductase (ER marker, 78 kDa), at 20 and 50 μg protein per lane; samples from control or TCDD treated CE produced essentially the same results. b. CYP1A4 and 1A5. Western blotting of mitochondria and microsomes with antisera immunoselective for CYP1A4 or 1A5 (55 and 55.5 kDa, respectively); 10 μg of protein per lane. See Fig. 4c for specificity of antibodies. c. CYP1A4 mediated EROD activity. Mean values ± SE are shown (n = 3 for control and TCDD treated groups). d. P450-dependent arachidonic acid (aa) metabolism. Representative reverse phase HPLC chromatograms for P450-dependent aa metabolism by liver mitochondria and microsomes assayed as described in “Materials and Methods”. Retention times for EETs and DHETs (min) are as follows: 25.5–27.0 (5, 6 EET); 24.8–25.5 (8, 9 EET); 24.0–24.8 (11, 12 EET); 22.8–23.8 (14, 15 EET); 14.5–15.8 (8, 9 DHET); 13.5–14.5 (11, 12 DHET) and 12–13.5 (14, 15 DHET). Retention time for 20-HETE (ω): 16.0–17.5 min, for aa: 32.5 – 35 min. Total counts (cpm) for each chromatogram (left to right): 170,924; 168,865; 173,800 and 177,203; 75 μg protein per reaction mixture. Peaks eluting before 10 min are polar non-enzymatic breakdown products present also in the blanks (aa metabolism reaction mixtures without tissue or NADPH). Results for the two other control and TCDD treated groups were essentially identical.
Figure 3
Figure 3. Peroxisomal contamination of mitochondrial fractions and isolation of peroxisomes
Samples shown are representative of livers from three independent groups of control and TCDD-treated CE. No differences were observed in the results using samples from control or TCDD treated CE. a. Western blots showing peroxisomal contamination of mitochondria prepared by Percoll-gradient or differential centrifugation. Mitochondria isolated by differential centrifugation (10,000g pellet), or utilizing a Percoll density gradient (Percoll mitochondria) and microsomes, immunoblotted using antibodies for porin (mitochondrial marker, 31 kDa), calnexin (ER marker, 78 kDa) and PMP70 (peroxisomal marker, 70 kDa). b. Isolation of peroxisomes free of mitochondria and a mitochondrial fraction (2,000g mitochondria) free of peroxisomes. Western blots of peroxisomes isolated using a Peroxisome Isolation Kit (Sigma-Aldrich), the 2000g mitochondria produced during that procedure, Percoll mitochondria and microsomes, using antibodies against PMP70 and porin.
Figure 4
Figure 4. P450 levels and activities in 2,000g mitochondrial preparations; CYP1A4 mitochondrial localization by immunofluorescence
2,000g mitochondria and microsomes were prepared as described in “Materials and Methods” from CE liver 24 hr after treatment with TCDD at 1 nmol/egg or dioxane, the solvent control, (8–10 eggs per group). a. Mitochondrial purity. Western blots of six groups of 2,000g mitochondria (from 3 control and 3 TCDD-treated groups of CE) using antibodies for porin (mitochondrial marker, 31 kDa) and calnexin (ER marker, 78 kDa); 40 and 80 μg of protein/lane. Microsomes from livers of control and TCDD treated CE are shown for comparison, at 80 μg of protein/lane. b. Western blotting for P450 reductase and ferredoxin reductase. Representative Western blots for microsomes and 2,000g mitochondria from control and TCDD treated CE, with antibodies to ferredoxin reductase or P450 reductase (48 and 78 kDa, respectively); all samples at 10 μg of protein/lane. c. Western blotting for CYP1A4 and CYP1A5. Representative Western blots for microsomes (lanes 1 and 2) at 10 μg per lane and 2,000g mitochondria (lanes 3–6), at 10 to 40 μg per lane, from control and TCDD treated CE livers, using immunospecific antibodies for CYP1A4 or CYP1A5 (55 and 55.5 kDa, respectively); last two lanes: purified CYP1A4 and CYP1A5 at 1.0 pmol/lane to demonstrate specificity of the antibodies. d. Western blotting for CYP4. Representative immunoblot for microsomes and 2,000g mitochondria from control and TCDD treated CE livers with an antibody to chick CYP4 (53 kDa) (see “Materials and Methods”); 25 μg of protein per lane. Microsomes and 2,000g mitochondria from the same membrane are shown (dotted line indicates where samples not relevant to these data were deleted from the picture shown). e. Immunofluorescence evidence for colocalization of CYP1A4 and mitochondria. D17 fibroblasts were stably transfected with a pCXIZ-CYP1A4 sense construct (see “Materials and Methods”). Cells were incubated with primary antibody to CYP1A4, using donkey anti-rabbit Alexa Fluor 488 as the secondary antibody (upper left panel), Mitotracker 580 to stain mitochondria (upper right panel) and DAPI (Sigma-Aldrich) to stain nuclei (lower left panel). Overlay (lower right panel) shows colocalization of mitochondria and CYP1A4 (yellow signal). An Axiovert 35, Zeiss fluorescence microscope was used for visualization (images shown were acquired at 63x). f. CYP1A4 mediated EROD activity. Values (mean ± SE) for EROD activity in microsomes and 2,000g mitochondria (n = 3 for each group). g . P450-dependent arachidonic acid (aa) metabolism. Representative HPLC chromatograms for P450-dependent aa metabolism by microsomes and 2,000g mitochondria from livers of control and TCDD treated CE, assayed at 75 and 150 μg protein per reaction mixture, for microsomes and mitochondria, respectively. Retention times for EETs, DHETs, 20-HETE and aa (min) as in Fig. 2d. Total counts (cpm) clockwise from top left to bottom left were 168,742; 186,617; 184,784 and 174,994.
Figure 5
Figure 5. Mitochondrial soluble epoxide hydrolase
a. Presence of soluble epoxide hydrolase (sEH) in CE liver mitochondria and peroxisomes. Western blots of peroxisomes, 2,000g mitochondria and microsomes prepared as described in “Materials and Methods”, with antibodies to soluble epoxide hydrolase (EPHX2/sEH, 63 kDa) and PMP70 (peroxisomal marker, 70 kDa). The blot shows representative samples from control livers. b. DHET formation by peroxisomes and 2,000g mitochondria. Four, 8 and 16 μg of protein from peroxisomes (squares) and mitochondria (triangles) from control CE livers were added to standard reaction mixtures for assaying microsomal aa metabolism, using microsomes from TCDD-treated CE liver (75 μg microsomal protein per reaction mixture) to generate EETs, as described in “Materials and Methods”. The production of EETs and DHETs after 10 min of incubation was measured. DHET formation, reflecting the sum of 8,9–11,12- and 14,15-DHETs (5,6-DHET was absent), is plotted in the graph. DHETs formed by microsomes alone (without addition of peroxisomes or 2,000g mitochondria; see Fig. 4g for example) were subtracted. c. Conversion by mitochondria of [1-14C] 11,12 and 14,15 EETs to the corresponding DHETs. [1-14C] 11,12 or 14,15 EET were incubated alone (top panels) or with 2,000g mitochondria from control (untreated) CE liver (bottom panels), at 50 μg of mitochondrial protein, for 20 min in a shaking water bath at 37°. The reaction was stopped and products were extracted and resolved on HPLC as described for aa metabolism in “Materials and Methods”. The EETs and corresponding DHETs exhibited the expected retention times (see legend to Fig. 2d). Total cpm in the chromatogram pairs were comparable: 1288 and 1505 for 11,12 EET alone or with mitochondria respectively, and 414 and 467 for 14,15 EET alone or with mitochondria. d. AUDA inhibits DHET formation by mitochondria. Reverse phase HPLC chromatograms for aa metabolism by 2,000g mitochondria (150 μg per reaction mixture) from livers of CE treated with TCDD for 24 hr in the absence (left panel) or presence (right panel) of 330 nM of AUDA are shown. Total cpm were 154,179 and 145,361 for the left and right panels respectively. Arachidonic acid metabolism was assayed as described in “Materials and Methods” except that mitochondria were first preincubated with AUDA for 10 min at 30° before adding the other components of the reaction mixture. The right panel shows the dose response relationships for suppression of DHET formation by AUDA at 10 to 330 nM (squares, EETs; triangles, DHETs). The distribution of EETs and DHETs in the absence of AUDA (43.3 ± 1.2 % and 56.7 ± 1.2 %, respectively) are plotted on the y axis; the SE is included in the symbol. Control values for mitochondrial EET and DHET formation in the absence of AUDA (pmol/mg/min ± SE) were 103 ± 5.6 for EETs, and 133 ± 3.8 for DHETs, n = 3.

References

    1. Rifkind AB. CYP1A in TCDD toxicity and in physiology-with particular reference to CYP dependent arachidonic acid metabolism and other endogenous substrates. Drug Metab Rev. 2006;38:291–335. - PubMed
    1. Omura T. Mitochondrial P450s. Chem Biol Interact. 2006;163:86–93. - PubMed
    1. Addya S, Anandatheerthavarada HK, Biswas G, Bhagwat SV, Mullick J, Avadhani NG. Targeting of NH2-terminal-processed microsomal protein to mitochondria: a novel pathway for the biogenesis of hepatic mitochondrial P450MT2. J Cell Biol. 1997;139:589–599. - PMC - PubMed
    1. Anandatheerthavarada HK, Vijayasarathy C, Bhagwat SV, Biswas G, Mullick J, Avadhani NG. Physiological role of the N-terminal processed P4501A1 targeted to mitochondria in erythromycin metabolism and reversal of erythromycin-mediated inhibition of mitochondrial protein synthesis. J Biol Chem. 1999;274:6617–6625. - PubMed
    1. Bhagwat SV, Mullick J, Raza H, Avadhani NG. Constitutive and inducible cytochromes P450 in rat lung mitochondria: xenobiotic induction, relative abundance, and catalytic properties. Toxicol Appl Pharmacol. 1999;156:231–240. - PubMed

Publication types

MeSH terms

LinkOut - more resources