. 2008 Jan;99(1):60-76.
doi: 10.1152/jn.00731.2007. Epub 2007 Oct 24.

Dominance of the proximal coordinate frame in determining the locations of hippocampal place cell activity during navigation

Affiliations

Dominance of the proximal coordinate frame in determining the locations of hippocampal place cell activity during navigation

Jennifer J Siegel et al. J Neurophysiol. 2008 Jan.

Abstract

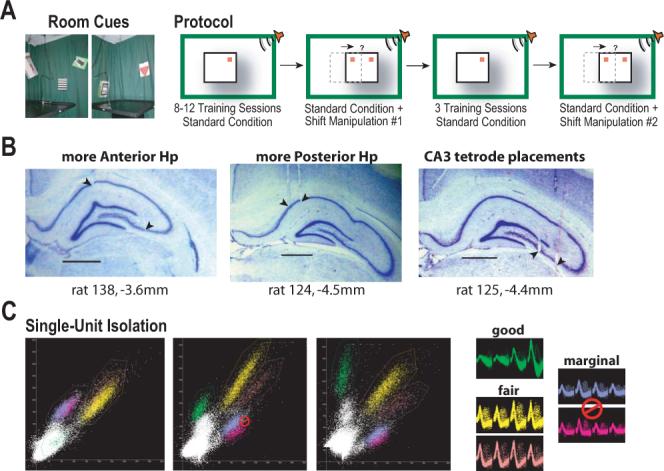
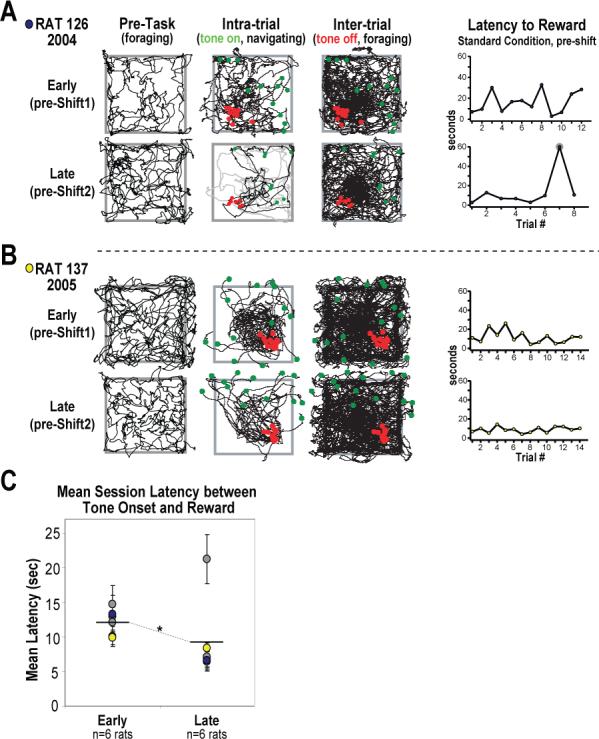
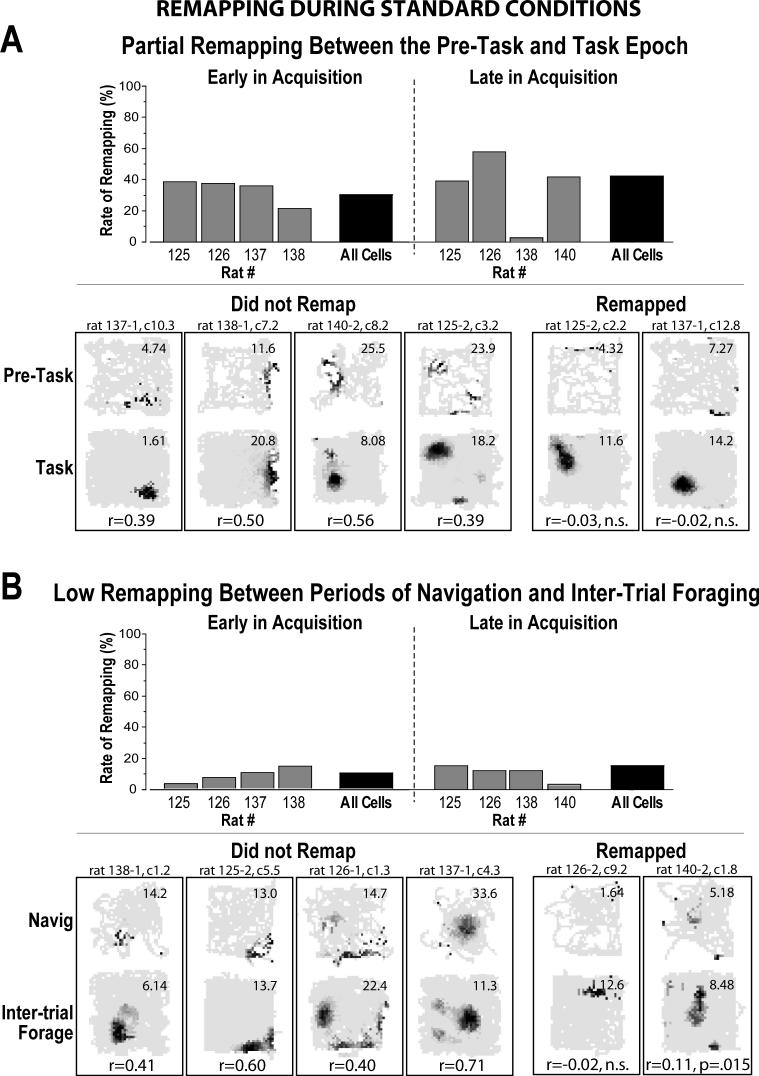
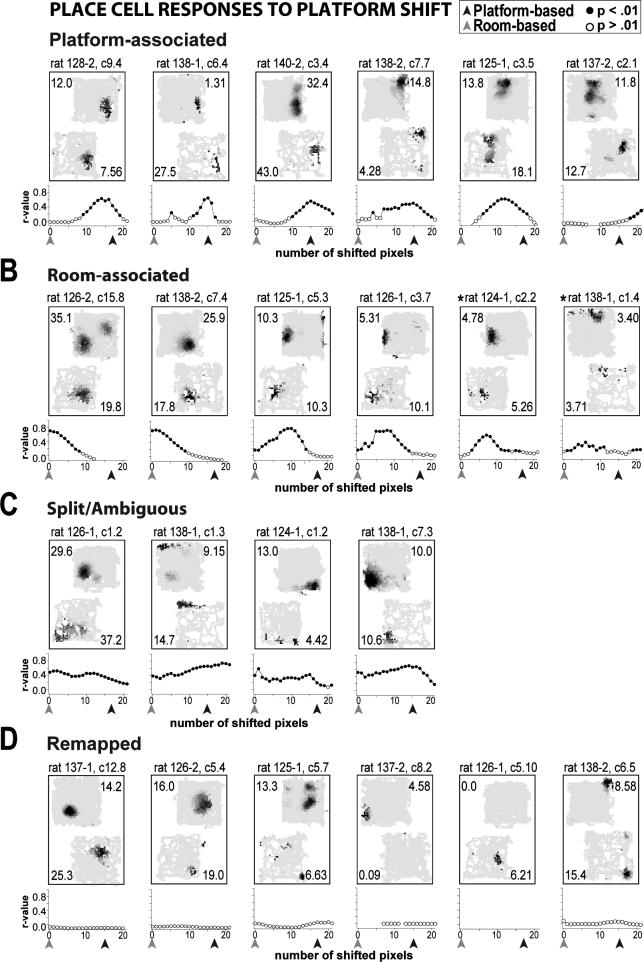
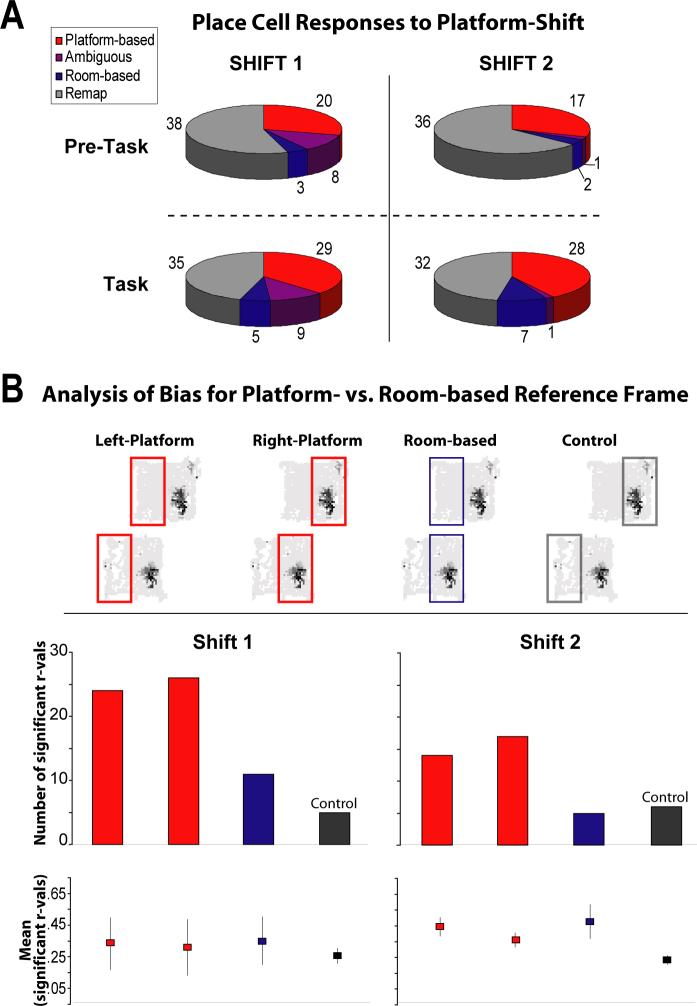
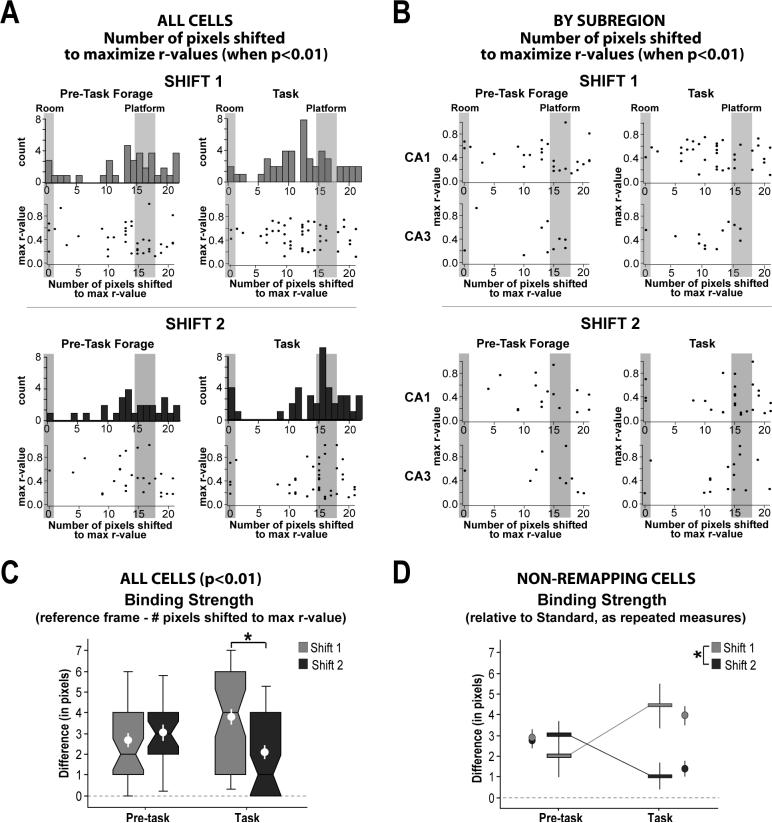
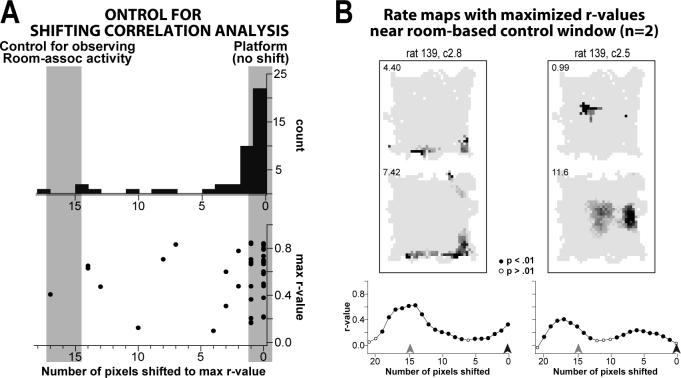
The place-specific activity of hippocampal cells provides downstream structures with information regarding an animal's position within an environment and, perhaps, the location of goals within that environment. In rodents, recent research has suggested that distal cues primarily set the orientation of the spatial representation, whereas the boundaries of the behavioral apparatus determine the locations of place activity. The current study was designed to address possible biases in some previous research that may have minimized the likelihood of observing place activity bound to distal cues. Hippocampal single-unit activity was recorded from six freely moving rats as they were trained to perform a tone-initiated place-preference task on an open-field platform. To investigate whether place activity was bound to the room- or platform-based coordinate frame (or both), the platform was translated within the room at an "early" and at a "late" phase of task acquisition (Shift 1 and Shift 2). At both time points, CA1 and CA3 place cells demonstrated room-associated and/or platform-associated activity, or remapped in response to the platform shift. Shift 1 revealed place activity that reflected an interaction between a dominant platform-based (proximal) coordinate frame and a weaker room-based (distal) frame because many CA1 and CA3 place fields shifted to a location intermediate to the two reference frames. Shift 2 resulted in place activity that became more strongly bound to either the platform- or room-based coordinate frame, suggesting the emergence of two independent spatial frames of reference (with many more cells participating in platform-based than in room-based representations).


Figures

Figure 1
Figure 1
Schematic of behavioral training protocol, example tetrode placements and single-unit isolation. A Pictures showing example room cues (left) and a schematic of the behavioral protocol (right). Rats received training in a tone-initiated place preference task for 8−12 sessions before the first platform-shift manipulation. Rats received 3 more days of training under standard conditions, with a second platform-shift manipulation performed following a standard session on the 4th day. Red squares illustrate the location of the unmarked goal under standard conditions, and possible room- or platform-associated goal locations in the platform-shifted condition. B Representative histology showing the placement of tetrodes across rats. Examples demonstrate the anterior and posterior extent of tetrode placements, with a number of CA3 cells recorded between the upper and lower blades of the dentate gyrus in addition to more lateral placements. No differences among anterior-posterior recording locations were noted in cell responses. (AP coordinates are relative to bregma; scale bar = 1 mm.) C Example scatter plots demonstrating the isolation of single-unit activity for a tetrode and typical ratings regarding the quality of isolation (good = 2 on a scale of 1−4, fair = 3, and marginal = 4; see Methods). The height of triggered waveform peaks were plotted for two wires of a tetrode and displayed as scatter plots. Note that clusters of single-unit activity overlap with each other (yellow with orange and blue with purple) or with background activity (green) on the first projection (left scatter plot), most of which are easily separated when two different wires from the same tetrode are paired (center and right scatter plots). Sampled waveforms are given for isolated single-units and two units that could not be isolated from each other as recorded from the four wires of the tetrode.
Figure 2
Figure 2
Behavior from two rats at two time points during the acquisition of the place preference task (at “early” and “late” phases of learning), and grouped data showing significant improvement in task performance (as measured by response latency). A,B Behavioral plots and trial response latencies for two rats from each of the groups trained in the task. Behavior is given for both the early (top row) and late (bottom row) phases of acquisition for epochs of pre-task foraging (left), and for concatenated periods of presumed navigation (“tone-on”, center) and inter-trial foraging (“tone-off”, right). Green and red dots represent a rat's location at the onset and offset of the tone, respectively. Note that early in acquisition both rats were inaccurate in locating the goal, often erring toward the center of the platform and having to make persistent corrective behaviors before finding the unmarked goal which triggered reward (top center plots). Late in acquisition rats were able to more accurately find the goal with less corrective behavior (bottom center plots) and shorter response latencies (line graphs, far right). Note that most rats would fail to respond in 1 of every 7−10 trials even late in acquisition, yielding longer response latencies on that trial (A, highlighted in gray on line graph, with behavior on that trial also in gray). The rat shown in B rarely failed to respond to tone-initiated trials. C Grouped data showing significant task improvement as measured by average response latencies. The improvement shown by the rat given in A is a typical example (denoted by blue markers). Note that the rat given in B (yellow dots) displayed the least improved response latencies, yet the improvement in behavior was notable (compare upper and lower navigating behavior plots). *p < .05.
Figure 3
Figure 3
Partial remapping rates between behavioral epochs under standard training conditions for ensembles of 10 or more cells (gray bars) and for all cells grouped together (black bars). A Partial remapping was observed between pre-task foraging and task-associated conditions at both the early and late phases of acquisition, as defined by the significance of rate map cross-correlations (see Methods). Rate maps with r-values representing the average correlation observed for non-remapping (left) and remapping cells (right) are given. B Relatively low remapping rates were observed between task-associated periods of tone-initiated navigation and inter-trial foraging. Rate maps with r-values representing the average observed correlation for both non-remapping (left) and remapping cells (right) are given. The pair of rate maps and corresponding r-value given at the far right represents cases in which the observed correlation borders on significance. The number at the upper right of each rate map indicates the maximum firing rate (i.e., the darkest pixel). Hyphenated number in cell ID is “1” for early in acquisition and “2” for late in acquisition, followed by the tetrode and cluster number relative to the individual rat.
Figure. 4
Figure. 4
Representative task-associated rate maps for categories of place cell responses to the platform-shift manipulation. Note that the observed r-values for each pixel-shift correlation (calculated at each step as the maps were aligned in 1 pixel increments) are plotted for each cell (filled black dots: p < .01, open dots: p > .01). A,B Cells with significant correlations observed at pixel-shifts corresponding to either the platform- (black arrows) or room- (gray arrows) based coordinate frame were defined as displaying platform- or room-associated activity, respectively. Additionally, cells displaying activity in between the two coordinate frames (>2 consecutive significant r-values) were categorized according to the reference frame to which the activity was more strongly bound (e.g., asterisks). A majority of cells displayed activity that was more strongly bound to the platform- than to the room-based coordinate frame (see text). C Cells with significant r-values at both coordinate frames were considered ambiguous. D Cells for which fewer than 3 consecutive significant r-values were observed in the shifting correlation analysis were defined as having remapped. Although sometimes a change in the location of place-specific activity between the standard and platform-shifted condition was observed (e.g., first two rate maps), most remapping was the result of a lack of place-specific firing in one condition (∼80%). Rate map scaling and cell identification conventions are described in Figure 3 caption.
Figure 5
Figure 5
Proportions of place cells observed in each response category for platform-shift manipulations at the early (Shift 1) and late (Shift 2) phases of task acquisition, and the results of a control analysis used to investigate the apparent bias in the prevalence of platform-associated activity relative to room-associated activity. Note that rate maps from pre-task foraging were analyzed separately from task-associated rate maps. A Pie graphs showing the proportions of cells falling into each category during pre-task and task epochs for Shift 1 and Shift 2 (the raw numbers of cells observed in each category are given). Note the decrease in the number of cells displaying ambiguous activity between Shift 1 and Shift 2. The difference between Shift 1 and Shift 2 (collapsed across pre-task and task epochs) was significant (X2 = 10.37, p = .02), but the difference between pre-task and task (collapsed across Shift 1 and Shift 2) failed to reach significance (X2 = 5.95, p = .11). Chi-square comparisons between pairs of individual pie graphs could not be performed due to the low number of cells categorized as room-associated or ambiguous in the pre-task epochs, resulting in expected values that were below 5.0 for tabulated categories. B Rate map comparisons that controlled for the amount of sampled space were made to determine if the apparent bias toward platform-associated activity reflected a real bias in the way hippocampal cells coded for momentary position in the platform-shifted condition. A similar number of significant correlations were observed for left and right half-platform comparisons (compare red bars within histograms), indicating that place fields were homogeneously distributed across the platform. Fewer significant room-based correlations were observed relative to platform-based comparisons, suggesting a bias in the way cells responded to the shifted platform (compare blue bars to the red bars within each histogram). Significant room-based correlations occurred more frequently than predicted from the control comparisons for Shift 1, but were observed at chance levels for Shift 2 (compare blue bar to black bar within histograms). However, room-based comparisons for Shift 2 yielded significantly higher r-values than controls (bottom graph, see text), indicating that room-based activity was significantly more similar to standard conditions than expected based on chance correlations.
Figure 6
Figure 6
The number of pixel-shifts necessary to maximize rate map similarity (r-values) between the standard and platform-shifted conditions for the pre-task and task epochs was used to examine the strength with which place cell activity was bound to either the room- or platform-based coordinate frame across experiences (only significant r-values are included).A Histograms based on Shift 1 data (light gray, top) reveal that during task conditions a majority of cells displayed place-specific activity that was more strongly bound to the platform-based coordinate frame (”Platform”) but that also was pulled in the direction of the room-based coordinate frame (”Room”). Histograms based on Shift 2 data (dark gray, bottom) reveal that during task conditions fewer observations fell in between the room- and platform-based coordinate frame, with most cells bound to either the room or platform coordinate frame with less interaction between the two. No differences were observed between r-values corresponding to the room- or platform-based coordinate frame, or at pixel-shifts that reflected an interaction between the two (scatter plots). B CA1 and CA3 cells did not respond differently to either the first or second platform-shift manipulation, and so were combined for further analysis (see text). C Notched box plots showing the binding strength of place cell activity to either the room- or platform-based coordinate frame (i.e., the difference between the number of pixels shifted to maximize r-values and the closest reference frame) for the pre-task epochs and task epochs of the first and second platform-shift experience. Note that lower values are indicative of stronger binding. Notched box plots were constructed from the median ± 25th and 75th IQRs (with bars giving the range and notches indicating 95% confidence intervals), and show the significantly skewed distributions observed in some cases. The mean ± SEM are also given (white markers). A significant difference in the binding of place-specific activity to either the platform- or room-based reference frame was observed between Shift 1 and Shift 2 only during task conditions. Although violations of the assumptions of a normal distribution and completely independent samples complicate the interpretation, a two-way ANOVA revealed a significant interaction (F1 = 8.02, p = .005) and a trend toward a main effect of Shift (F1 = 3.27, p = .07), in support of the analogous nonparametric tests (see text). The main effect of pre-task x task was not significant (F1 = 0.05, p = .82). D Limiting the analysis to cells that did not remap across task conditions (between the pre-task and task epochs, allowing for a repeated measure) revealed that on average individual cells became more strongly bound to either the room- or platform-based coordinate frame during Shift 2 with the initiation of task conditions. Horizontal bars reflect median ± confidence intervals. Means ± SEMs are given to the side (light and dark gray markers).
Figure 7
Figure 7
Results of a control comparison for the shifting correlation analysis in which rats were reintroduced back into the environment with the platform still in its standard condition (i.e., the platform was not shifted within the room-based coordinate frame, see text), used to examine the degree to which accurate place-specific activity could be reproduced under spatially stable conditions (”Platform”) and as a control to investigate the likelihood that room-associated activity could have been observed by chance in the shifting correlation analysis (”Control”; x-axis is reversed to facilitate comparisons with data given in Fig. 6A). A Histogram of the number of pixel-shifts necessary to maximize rate map similarity (r-values) between the standard and platform-stable conditions (plotted in association with the corresponding r-values, scatter plot below). Most cells displayed place-specific activity that was accurate to within 1 pixel-shift under stable conditions (“Platform, no shift”). Additionally, few significant r-values were maximized near the control for room-based comparisons (at 15 pixels for one group of rats and 17 pixels for the second group, “Control”), suggesting that spurious correlations were unlikely to occur by chance. B Rate maps and graphs of shifting-correlation r-values for the 2 cells that displayed maximum r-values within 2 pixel-shifts of the control comparison for the room-based coordinate frame. The shifting correlation graphs for room-associated cells typically did not show the same pattern of results as the control comparisons yielded here (compare the graphs given here with those given in Fig. 4C), suggesting that most cells categorized as room-associated were not the result of similar spurious correlations.

References

    1. Anderson MI, Jeffery KJ. Heterogeneous modulation of place cell firing by changes in context. J Neurosci. 2003;23:8827–8835. - PMC - PubMed
    1. Anderson MI, Killing S, Morris C, O'Donoghue A, Onyiagha D, Stevenson R, Verriotis M, Jeffery KJ. Behavioral correlates of the distributed coding of spatial context. Hippocampus. 2006;16:730–742. - PubMed
    1. Barry C, Lever C, Hayman R, Hartley T, Burton S, O'Keefe J, Jeffery K, Burgess N. The boundary vector cell model of place cell firing and spatial memory. Rev Neurosci. 2006;17:71–97. - PMC - PubMed
    1. Blodgett HC, McCutchan K, Matthews R. Spatial learning in the T-maze; the influence of direction, turn, and food location. J Exp Psychol. 1949;39:800–809. - PubMed
    1. Bower MR, Euston DR, McNaughton BL. Sequential-context-dependent hippocampal activity is not necessary to learn sequences with repeated elements. J Neurosci. 2005;25:1313–1323. - PMC - PubMed

Publication types

MeSH terms

LinkOut - more resources