. 2007 Oct 30;104(44):17370-5.
doi: 10.1073/pnas.0708066104. Epub 2007 Oct 24.

Dynamic clustered distribution of hemagglutinin resolved at 40 nm in living cell membranes discriminates between raft theories

Affiliations

Dynamic clustered distribution of hemagglutinin resolved at 40 nm in living cell membranes discriminates between raft theories

Samuel T Hess et al. Proc Natl Acad Sci U S A. .

Abstract

Organization in biological membranes spans many orders of magnitude in length scale, but limited resolution in far-field light microscopy has impeded distinction between numerous biomembrane models. One canonical example of a heterogeneously distributed membrane protein is hemagglutinin (HA) from influenza virus, which is associated with controversial cholesterol-rich lipid rafts. Using fluorescence photoactivation localization microscopy, we are able to image distributions of tens of thousands of HA molecules with subdiffraction resolution ( approximately 40 nm) in live and fixed fibroblasts. HA molecules form irregular clusters on length scales from approximately 40 nm up to many micrometers, consistent with results from electron microscopy. In live cells, the dynamics of HA molecules within clusters is observed and quantified to determine an effective diffusion coefficient. The results are interpreted in terms of several established models of biological membranes.


Conflict of interest statement

The authors declare no conflict of interest.

Figures

Fig. 1.
Fig. 1.
Nanoscale visualization of intracellular proteins by FPALM. HA from influenza was tagged with PA-GFP, expressed in HAb2 fibroblasts, and imaged by widefield fluorescence microscopy (A) and FPALM (B), illustrating the agreement between the two methods and the drastic improvement in resolution by FPALM. (C–E) Zoom-in of the green box shown in B showing widefield fluorescence (C), FPALM (D), and two-color merge with widefield in red and FPALM in green (E). (F–H) Zoom-in of the green box shown in D with the same arrangement of images as in C–E. Note in G that the structures observed are on length scales well below the diffraction-limited resolution of ≈264 nm. (I) Confocal slice through a live fibroblast transfected with EGFP-HA and labeled with Rhod-DOPE imaged at room temperature demonstrates membrane labeling of HA. (J) FPALM of HA in a living fibroblast. (K) Zoom-in of region outlined by red box shown in J.
Fig. 2.
Fig. 2.
Elongated HA clusters imaged by FPALM in live cells and by EM of fixed cell membrane sheets. (A) FPALM image of a subregion of the coverslip-proximal plasma membrane of a live fibroblast, with molecular positions plotted in gray. For comparison with EM, greater intensity and/or numbers of molecules are indicated by darker gray. The image shows localized HA molecules in a clustered distribution with sometimes elongated shapes (black arrows). (B) Transmission electron micrograph demonstrating a clustered distribution of immunogold-labeled HA in fibroblast membrane sheets. Note both the compact cluster (red asterisks) and elongated cluster (black arrows) geometries. (Scale bar: 500 nm; applies to both images.)
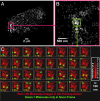
Fig. 3.
Fig. 3.
Time dependence of positions of localized HA molecules within an HA cluster in a live fibroblast at room temperature. (A) FPALM image of a whole cell. (B) Zoomed view of area in A enclosed in dashed magenta box. (C) Successive frames from the 0.4 μm × 0.4 μm region outlined by the green box in B. Time is shown on each frame in seconds (yellow text); molecules localized in the current frame are shown as green spots superimposed on a red image of all molecules localized within that region during the full acquisition. Many molecules are visible for more than one frame (typically two to five frames) before photobleaching and provide information about molecular dynamics. Molecules are plotted as Gaussian spots with a 1/e2 radius of 40 nm. Brighter regions in the image correspond to larger numbers of molecules (see color bar).
Fig. 4.
Fig. 4.
Distribution of radial HA–HA distances vs. time in live and fixed HAb2 fibroblasts expressing PA-GFP-HA. (A and B) Striking differences in distribution of distances squared between HA molecules in a given frame and HA molecules in the frame k frames later, comparing live cells (n = 11) (A) and fixed cells (n = 16) (B), for various values of k. (C and D) The sum of all histograms for all values of k, corrected for differences in time delay between frames, is shown for live cells (C) and fixed cells (D), and was fitted by using an exponential decay as a function of distance squared (Eq. 1). The small value of σ2 = 0.0025 ± 0.0003 μm2 for fixed cells indicates that molecules in later frames remain relatively close to molecules in a given frame (usually within ±σx), whereas in live cells, σ2 = 0.0338 ± 0.0016 μm2 indicates that molecules in later frames are found at significantly larger distances from the molecules in a given frame. The time difference between the frames is linearly proportional to k. (E) Temporal dependence of distribution of HA–HA distances is described by diffusion with a small immobile fraction. The total number of HA–HA distances between 0.1 and 0.56 μm was plotted as a function of time between the frames, for live cells (red circles) and fixed cells (blue triangles) at room temperature. The HA–HA distances were between each HA in a given frame and each HA in a later frame. This distribution was then fitted by Eq. 1, using the diffusion coefficient D = 0.086 ± 0.018 μm2/s, a constant time-independent offset, and r = 0.34 μm (solid line). Note the deviation between the fit and observed live-cell distribution for time delay <0.3 s. (F) Normalized K test of PA-GFP-HA imaged by FPALM in live and fixed fibroblasts confirms clustering results obtained by immunogold EM (10) for length scales where overlapping data are available (<0.7 μm). Clustering was observed on length scales from ≈20 nm up to ≈2.5 μm. Results from fixed cells (blue line; n = 16) and live cells (red line; n = 9) plotted ±1 SD (pale blue and pale red) are both significantly above the confidence interval for nonrandomness (dotted green line).

References

    1. Simons K, Ikonen E. Nature. 1997;387:569–572. - PubMed
    1. Manes S, del Real G, Martinez C. Nat Rev Immunol. 2003;3:557–568. - PubMed
    1. White J, Helenius A, Gething MJ. Nature. 1982;300:658–659. - PubMed
    1. Takeda M, Leser GP, Russell CJ, Lamb RA. Proc Natl Acad Sci USA. 2003;100:14610–14617. - PMC - PubMed
    1. Anderson RGW, Jacobson K. Science. 2002;296:1821–1825. - PubMed

Publication types

MeSH terms