. 2007 Oct 30;104(44):17300-4.
doi: 10.1073/pnas.0704256104. Epub 2007 Oct 24.

Engineered bidirectional communication mediates a consensus in a microbial biofilm consortium

Affiliations

Engineered bidirectional communication mediates a consensus in a microbial biofilm consortium

Katie Brenner et al. Proc Natl Acad Sci U S A. .

Abstract

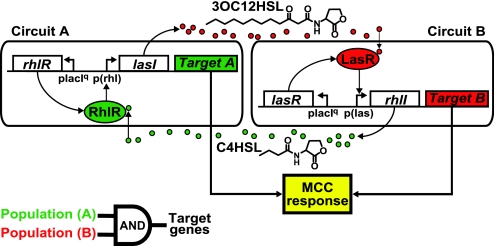
Microbial consortia form when multiple species colocalize and communally generate a function that none is capable of alone. Consortia abound in nature, and their cooperative metabolic activities influence everything from biodiversity in the global food chain to human weight gain. Here, we present an engineered consortium in which the microbial members communicate with each other and exhibit a "consensus" gene expression response. Two colocalized populations of Escherichia coli converse bidirectionally by exchanging acyl-homoserine lactone signals. The consortium generates the gene-expression response if and only if both populations are present at sufficient cell densities. Because neither population can respond without the other's signal, this consensus function can be considered a logical AND gate in which the inputs are cell populations. The microbial consensus consortium operates in diverse growth modes, including in a biofilm, where it sustains its response for several days.


Conflict of interest statement

The authors declare no conflict of interest.

Figures

Fig. 1.
Fig. 1.
The MCC. Two E. coli cell populations communicate by using P. aeruginosa quorum sensing components to achieve a consensus response. In Circuit A, the LasI protein catalyzes synthesis of 3OC12HSL. 3OC12HSL diffuses into cells containing Circuit B, forms a complex with LasR, and activates the Las promoter. Similarly, RhlI catalyzes production of C4HSL in Circuit B, which diffuses into Circuit A, forms a complex with RhlR, and activates the Rhl promoter. Expression of both Targets A and B constitutes the MCC response and can be regarded as implementing a logical AND gate operation (lower left) where the two cell populations are the inputs and target gene expression is the output. Detailed plasmid maps for these circuits are shown in SI Fig. 9.
Fig. 2.
Fig. 2.
Initial characterization of the MCC. (A) Modeling results depicting AND gate activity of the Circuit A and B populations. Target genes are expressed at high levels only when both populations are present at adequate population densities. To optimize performance of the AND gate, it is necessary to maximize the population density required for one population to self-activate (isolation activation) while minimizing the population density required for activation of each circuit in the presence of the other (activation by consensus). A more formal analysis is included in SI Text, Rate-Equation Based Model. (B) Liquid phase characterization of the MCC confirms the modeling results in A. Median single-cell fluorescence is depicted for each circuit as a function of the OD of cells containing Circuits A and B. When cells containing Circuits A and B are grown such that they can communicate with one another, fluorescence is >100-fold higher than when they are grown in isolation. Fluorescence with respect to time is illustrated in SI Fig. 10. Circuit A cells grow more slowly than Circuit B cells in liquid phase, possibly because a higher metabolic cost is associated with production of 3OC12HSL (from LasI in Circuit A) than production of C4HSL (from RhlI in Circuit B) or because high intracellular concentrations of 3OC12HSL may have toxic effects. However, both populations reach stationary phase within 20 h of growth in liquid culture (Inset).
Fig. 3.
Fig. 3.
The MCC response is achieved by spatial colocalization of cells containing Circuits A and B. (A) A gradient of fluorescence emerges from the interface between an agar slice with embedded Circuit A cells and another slice with embedded Circuit B cells. (B) Image analysis of the experiment in A, depicting the log of fluorescence. The pixels immediately surrounding the interface between agar slices were not quantified and were replaced with a black strip, because fluorescence in the boundary region may not accurately represent target-gene expression. Details regarding image processing are available in SI Text, Solid-Phase Imaging Equipment and Settings.
Fig. 4.
Fig. 4.
Monoculture biofilms respond to higher concentrations of acyl-HSL with higher levels of GFP expression. (A) Circuit A fluoresces minimally when 0.1 μM C4HSL is administered (blue), but fluorescence increases at 0.5 μM (green) and 5.0 μM (yellow) C4HSL, and saturates at 10 μM (orange) and 25 μM (red) C4HSL. (Inset) Mean fluorescence at each C4HSL concentration. (B) Circuit B fluoresces minimally in response to 0.001 μM (purple) C12HSL, but fluorescence increases at 0.01 μM (blue), 0.05 μM (green), 0.1 μM (yellow), and 0.5 μM (orange) C12HSL, and saturates at 1.0 μM (red) C12HSL. (Inset) Mean fluorescence at each C12HSL concentration. Details regarding image processing are available in SI Text, Biofilm Imaging Equipment and Settings.
Fig. 5.
Fig. 5.
The MCC functions for at least 6 days when grown in a biofilm. (A) Three-dimensional rendering of an MCC biofilm, 24 h after inoculation, shows that both Circuit A and B cells are present and fluorescing. Circuit A cells constitutively express enhanced yellow fluorescent protein (eYFP; shown in yellow) and express GFP when the circuit is “on.” Circuit B cells constitutively express enhanced cyan fluorescent protein (eCFP; shown in cyan) and express ds-Red when the circuit is “on.” Circuit A cells are a minority, possibly because of their slower growth. (B) Mean intensities for Circuit A and Circuit B cells remain significant for at least 120 h after inoculation. (C) Monoculture biofilms of Circuit A cells fluoresce minimally. (D) Monoculture biofilms of Circuit B cells fluoresce minimally. All gridlines are 20 μm apart. Details regarding image processing are available in SI Text, Biofilm Imaging Equipment and Settings.

References

    1. Hooper LV, Midtvedt T, Gordon JI. Annu Rev Nutr. 2002;22:283–307. - PubMed
    1. Kato S, Haruta S, Cui ZJ, Ishii M, Igarashi Y. Appl Environ Microbiol. 2005;71:7099–7106. - PMC - PubMed
    1. Kleessen B, Blaut M. Br J Nutr. 2005;93(Suppl 1):S35–S40. - PubMed
    1. Macfarlane S, Woodmansey EJ, Macfarlane GT. Appl Environ Microbiol. 2005;71:7483–7492. - PMC - PubMed
    1. Mishra S, Jyot J, Kuhad RC, Lal B. Curr Microbiol. 2001;43:328–335. - PubMed

Publication types

LinkOut - more resources