Comparative Study
. 2007 Oct 24;27(43):11483-95.
doi: 10.1523/JNEUROSCI.3406-07.2007.

Defects in embryonic neurogenesis and initial synapse formation in the forebrain of the Ts65Dn mouse model of Down syndrome

Affiliations
Comparative Study

Defects in embryonic neurogenesis and initial synapse formation in the forebrain of the Ts65Dn mouse model of Down syndrome

Lina Chakrabarti et al. J Neurosci. .

Abstract

Trisomy 21, one of the most prevalent congenital birth defects, results in a constellation of phenotypes collectively termed Down syndrome (DS). Mental retardation and motor and sensory deficits are among the many debilitating symptoms of DS. Alterations in brain growth and synaptic development are thought to underlie the cognitive impairments in DS, but the role of early brain development has not been studied because of the lack of embryonic human tissue and because of breeding difficulties in mouse models of DS. We generated a breeding colony of the Ts65Dn mouse model of DS to test the hypothesis that early defects in embryonic brain development are a component of brain dysfunction in DS. We found substantial delays in prenatal growth of the Ts65Dn cerebral cortex and hippocampus because of longer cell cycle duration and reduced neurogenesis from the ventricular zone neural precursor population. In addition, the Ts65Dn neocortex remains hypocellular after birth and there is a lasting decrease in synaptic development beginning in the first postnatal week. These results demonstrate that specific abnormalities in embryonic forebrain precursor cells precede early deficits in synaptogenesis and may underlie the postnatal disabilities in Ts65Dn and DS. The early prenatal period is therefore an important new window for possible therapeutic amelioration of the cognitive symptoms in DS.


Figures
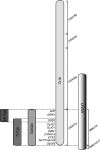
Figure 1.
Figure 1.
Schematic illustration of the synteny between human chromosome 21 (HSA21) and mouse chromosome 16 (MMU16). MMU16 is orthologous to segments of 10 different human chromosomes, some of which are depicted in Fig. 1. Specifically, 51, 19, 17, and 10% of all mouse chromosome 16 genes are orthologous to human chromosomes 3, 21, 16, and 22, respectively (based on http://www.informatics.jax.org/, August 24, 2007). The remaining 3% of mouse chromosome 16 genes are orthologous to human chromosomes 2, 8, 10, 12, 13, and 17. The Ts16 model contains an extra copy of the entire MMU16, whereas Ts65Dn contains a partial triplication of the distal region of MMU16 syntenic to the long arm of HSA21. Several other mouse models, such as the Ts1Cje and Ms1Cje models (Sago et al., 1998, 2000) contain smaller triplicated segments of MMU16. Future studies in these segmental trisomic models will be useful to narrow the search for the particular genes responsible for the various phenotypic abnormalities observed in DS, Ts16, and Ts65Dn (Olson et al., 2004). App, Amyloid precursor protein; GRIK1, kainate selective glutamate receptor 5; SOD1, superoxide dismutase; OLIG1 and OLIG2, oligodendrocyte lineage transcription factors 1 and 2; SIM2, single minded 2; DYRK1A, dual-specificity tyrosine-regulated kinase 1A; ETS2, E-26 avian leukemia oncogene 2,3′ domain; Mx1, myxovirus resistance 1; Tmprss2, transmembrane protease serine 2; Zfp295, zinc finger protein 295.
Figure 2.
Figure 2.
A quantitative PCR method for Ts65Dn genotyping. Our qPCR methods were modified from a previous report by Liu et al. (2003). A, qPCR with App as the target gene. For the euploid animals, the cycle threshold (CT) is exactly same for FAM (green) and TxRed (red). For Ts65Dn, the CT for FAM is 0.6 cycles earlier than TxRed because of the presence of an extra copy of App in trisomic embryos. The average ΔCT (CTApp − CTApoB) for Ts65Dn ranges from −0.5 to −0.75. B, qPCR with Mx1 as the target gene. For the euploid animals, the cycle threshold (CT) is exactly same for FAM (green) and TxRed (red). For Ts65Dn, the CT for FAM is 1.0 cycle earlier than TxRed because of the presence of an extra copy of Mx1 in trisomic embryos. The average ΔCT (CTMx1 − CTApoB) for Ts65Dn ranges from −1.0 to −1.2. C, The Down syndrome critical region (DSCR) of MMU16 detected by FISH in interphase nuclei appears as a red punctuate spot, and nuclear DAPI staining is blue. Ts65Dn nuclei are characterized by the presence of three red puncta indicating triplication of DSCR, whereas the euploid nucleus (inset) has two red puncta.
Figure 3.
Figure 3.
Gross pathology of the developing Ts65Dn brain. A, Microcephaly of the Ts65Dn forebrain at midgestation (E14.5). B, The medial-lateral length of the forebrain was smaller in Ts65Dn embryos compared with euploid littermates at E13.5, E14.5, and E16.5. C, Significant reduction was found in wet brain weight in Ts65Dn embryos at E14.5, E15.5, and E16.5. Data points represent mean ± SD (n = 6–8 mice for each age in each genotype group). *p < 0.03 by Bonferroni's correction. Scale bar, 1 mm.
Figure 4.
Figure 4.
Histology of the embryonic Ts65Dn neocortex, a transient delay in expansion. A, Nissl-stained images of coronal sections from euploid (left) and Ts65Dn (right) taken from matched sections at the level of future sensorimotor cortex. From E13.5 to E16.5, Ts65Dn brains are qualitatively different from the euploid brains in pallial thickness and overall size of the brain. By E18.5, the Ts65Dn brain appears normal with respect to controls. The boxed areas in A are shown at higher magnification in B and represent the mediolateral position used for layer thickness measurements. B, Higher magnification images of the neocortical wall taken at the midpoint between the medial and lateral angles of the lateral ventricle show a substantially delayed growth of IZ and SP/CP in Ts65Dn from E13.5 to E16.5. The combined effects on Ts65Dn IZ+ SP/CP result in an overall reduction in the thickness of the pallium. By E18.5, the Ts65Dn neocortical wall has normal thickness compared with euploid controls. C, Measurements (blue, euploid; red, Ts65Dn) of neocortical radial expansion demonstrate that there is a transient delay in growth of the Ts65Dn neocortical wall from E13.5 to E16.5 and that the Ts65Dn neocortex grows to normal size by E18.5. Data points represent mean ± SD (n = 8 mice for each age and group). *p < 0.02 by Bonferroni's correction. Scale bars: A, 200 μm; B, 50 μm.
Figure 5.
Figure 5.
Histology of the embryonic Ts65Dn hippocampus. A, Nissl-stained images of the CA1 region at E14.5 and E15.5 show a decrease in the expansion of Ts65Dn hippocampal wall compared with euploids. At E18.5, dentate gyrus is hypocellular and the pyramidal layer is thinner in Ts65Dn hippocampus. B, Hippocampal layer thickness measurements (blue, euploid; red, Ts65Dn) demonstrate reduced thickness of the Ts65Dn pyramidal layer from E16.5 onward and of the pallium at E14.5, E15.5, and E18.5. PL, Pyramidal layer. Data points represent mean ± SD (n = 8 mice for each age and group). *p < 0.05 by Bonferroni's correction. Scale bars, 100 μm.
Figure 6.
Figure 6.
Longer cell cycle phases in the embryonic Ts65Dn neocortex and hippocampus. A–D, The cumulative BrdU labeling method was used to measure the growth fraction (GF) and TcTs, where Tc represents the duration of the entire cell cycle and Ts is the duration of S-phase. A, The cumulative BrdU labeling protocol consisted of repetitive intraperitoneal BrdU injections to timed pregnant Ts65Dn females for up to 24 h, each spaced 2 h apart. The red arrows represent the time points at which embryos were harvested. B, The VZ is an active proliferative population, shown here by the increase in density of BrdU-labeled nuclei in neocortex from 2 to 6 h as additional cycling VZ cells are exposed to BrdU. C, D, The cumulative labeling plots for neocortical (blue, euploid, r2 = 0.892; red, Ts65Dn, r2 = 0.936) and hippocampal (euploid, r2 = 0.906; Ts65Dn, r2 = 0.945) VZ demonstrate that the labeling index (percentage of BrdU+ cells) rises precipitously until reaching saturation at the GF value, which represents the proportion of VZ cells that are participating in the cell cycle. The time to reach saturation defines the TcTs value, which was significantly longer in Ts65Dn VZ compared with controls (Table 1). E–G, Determination of S-phase duration using an IdU/BrdU double-labeling approach. E, The exiting rate of cells in S-phase determine the overall S-phase duration (Martynoga et al., 2005). An intraperitoneal injection of IdU was followed 1.5 h later by an intraperitoneal injection of BrdU. Thirty minutes later, the embryos were harvested. F, The immunohistochemical procedure labeled all IdU and BrdU cells with green fluorescence and a second reaction also labeled BrdU+ cells with a red fluorophore. Thus, the IdU+ cells were green and BrdU+ cells were double labeled (yellow). The white arrows show the green IdU+ only cells, which had left the S-phase during the 1.5 h period between pulses. Higher magnification of IdU+ cells is shown (inset). G, At E14.5, Ts is 1.1 and 1.6 h longer in Ts65Dn neocortical and hippocampal VZ precursor cells compared with euploid controls. We measured a similar increase in Ts at E13.5 in the Ts65Dn neocortex and hippocampus (Table 1). Data points represent mean ± SD (n = 4–6 for each age and group). *p < 0.01 by paired t test. Scale bars: B, 20 μm; F, 30 μm.
Figure 7.
Figure 7.
Reduced neurogenesis and slower neuronal migration in Ts65Dn neocortex (A–G). E13.5 timed pregnant Ts65Dn females were injected (intraperitoneally) with BrdU to label a cohort of neural progenitors in S-phase and embryos were harvested 24 or 48 h later. The number and radial position of heavily BrdU+ cells in the neocortex were measured for both time points. A, Examples of the range of nuclear BrdU labeling observed. Only cells with >70% of the nucleus stained for BrdU were scored (represented by the cells within the red bracket). Cells with less nuclear BrdU staining were considered to have gone through additional mitotic divisions and were omitted from the counts. B–D, At 24 h after injection, the number of heavily BrdU+ cells in the Ts65Dn IZ and SP/CP was significantly less than that of euploid controls, suggesting that fewer cells had exited the cell cycle and differentiated into migrating neurons during this period of time. In addition, these fewer Ts65Dn neurons migrated at a slower rate; all were found only in the IZ, whereas 20% of the euploid neurons had already migrated into the SP/CP. Data points represent mean ± SD (n = 3 pairs). E–G, Fewer heavily BrdU-labeled neurons were also found in Ts65Dn 48 h after injection. Most of the newly generated neurons in Ts65Dn neocortex had migrated into the IZ, but fewer neurons were found in the SP/CP compared with euploid controls. Data points represent mean ± SD (n = 2 pairs). H–J, At 24 h after BrdU injection, sections were stained with antibodies to Ki67 (red) and BrdU (green). The fraction of cells labeled only with BrdU (BrdU+/Ki67; no longer dividing) 24 h after pulse label is 47% smaller in Ts65Dn. Data points represent mean ± SD (n = 3 pairs). *p < 0.01 by paired t test. Scale bar, 20 μm.
Figure 8.
Figure 8.
Increased activity in the SVZ. A, Tbr2 immunohistochemistry demonstrates the enlargement of the Tbr2+ intermediate progenitor population in the E16.5 Ts65Dn SVZ compared with euploid littermate. B, The Tbr2 labeling index, which represents the percentage of Tbr2+ cells in an area of 100 × 200 μm, was increased at E16.5 in the Ts65Dn neocortex SVZ (n = 3 pairs). No change was observed in the distribution of the Tbr2+ population throughout the pallial wall (data not shown). C, Increased mitosis in Ts65Dn SVZ. The yellow arrows point to the abventricular dividing cells at E16.5. D, The percentage of abventricular mitotic cells rapidly increased in the Ts65Dn neocortex after E15.5. *p < 0.02 by paired t test. Scale bars: A, 50 μm; C, 20 μm.
Figure 9.
Figure 9.
Reduced synaptogenesis in Ts65Dn neocortex and hippocampus. Total protein levels for synaptophysin (SY38) and postsynaptic density protein (PSD95) were measured in P8 neocortex and hippocampus. A, A representative Western blot from one Ts65Dn/euploid littermate pair. B, Quantification of SY38 and PSD95 band densitometries sorted by region shows lower amounts of protein in Ts65Dn. Data points represent mean ± SD (n = 3 pairs). *p < 0.05 by paired t test. C, Quantification of the number of synaptic puncta in hippocampal volume reconstructions shows fewer postsynaptic terminals in the stratum lucidum in the CA3, whereas both presynaptic and postsynaptic terminals are reduced in the stratum oriens of CA1. Data points represent mean ± SD (n = 5 pairs). *p < 0.03 by paired t test. D, Immunofluorescence staining demonstrating the reduced intensity and smaller number of presynaptic and postsynaptic puncta in Ts65Dn cortical layers. E, Quantification of the number of synaptic puncta shows fewer presynaptic and postsynaptic terminals in all the layers of the Ts65Dn cortex. Data points represent mean ± SD (n = 5 pairs). *p < 0.009 by paired t test. Scale bar, 50 μm.

Similar articles

Cited by

References

    1. Altman J, Bayer SA. Mosaic organization of the hippocampal neuroepithelium and the multiple germinal sources of dentate granule cells. J Comp Neurol. 1990;301:325–342. - PubMed
    1. Baxter LL, Moran TH, Richtsmeier JT, Troncoso J, Reeves RH. Discovery and genetic localization of Down syndrome cerebellar phenotypes using the Ts65Dn mouse. Hum Mol Genet. 2000;9:195–202. - PubMed
    1. Becker LE, Armstrong DL, Chan F. Dendritic atrophy in children with Down's syndrome. Ann Neurol. 1986;20:520–526. - PubMed
    1. Belichenko PV, Masliah E, Kleschevnikov AM, Villar AJ, Epstein CJ, Salehi A, Mobley WC. Synaptic structural abnormalities in the Ts65Dn mouse model of down syndrome. J Comp Neurol. 2004;480:281–298. - PubMed
    1. Benavides-Piccione R, Ballesteros-Yanez I, de Lagran MM, Elston G, Estivill X, Fillat C, Defelipe J, Dierssen M. On dendrites in Down syndrome and DS murine models: a spiny way to learn. Prog Neurobiol. 2004;74:111–126. - PubMed

Publication types