

Cortical folding abnormalities in autism revealed by surface-based morphometry
- PMID: 17959814
- PMCID: PMC6673212
- DOI: 10.1523/JNEUROSCI.0777-07.2007
Cortical folding abnormalities in autism revealed by surface-based morphometry
Abstract
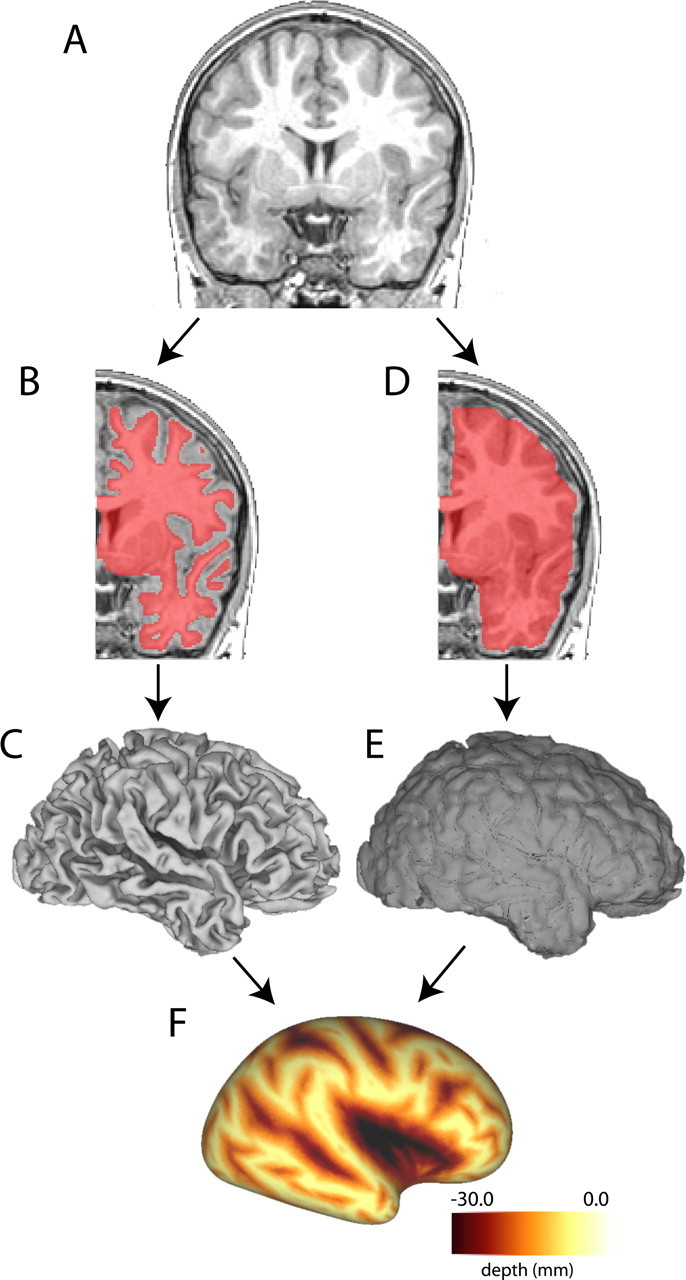
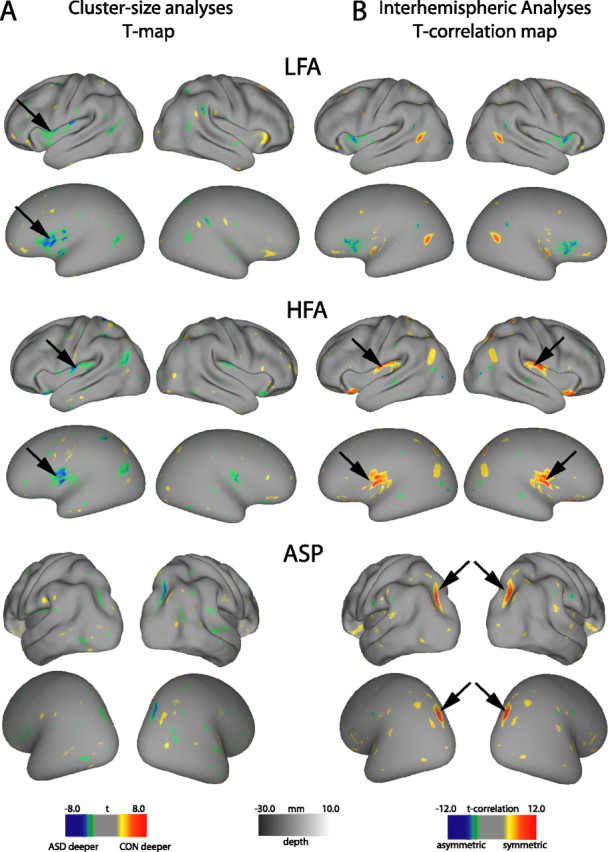
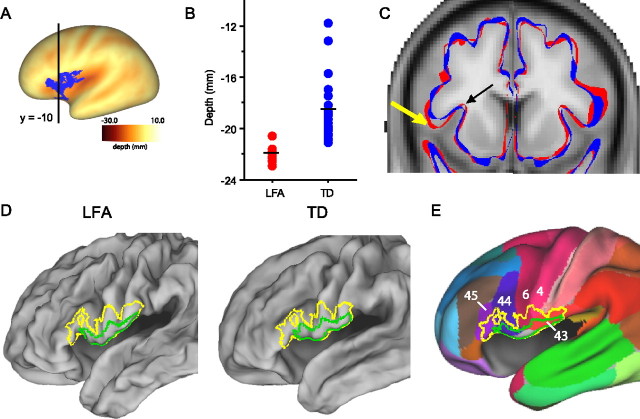
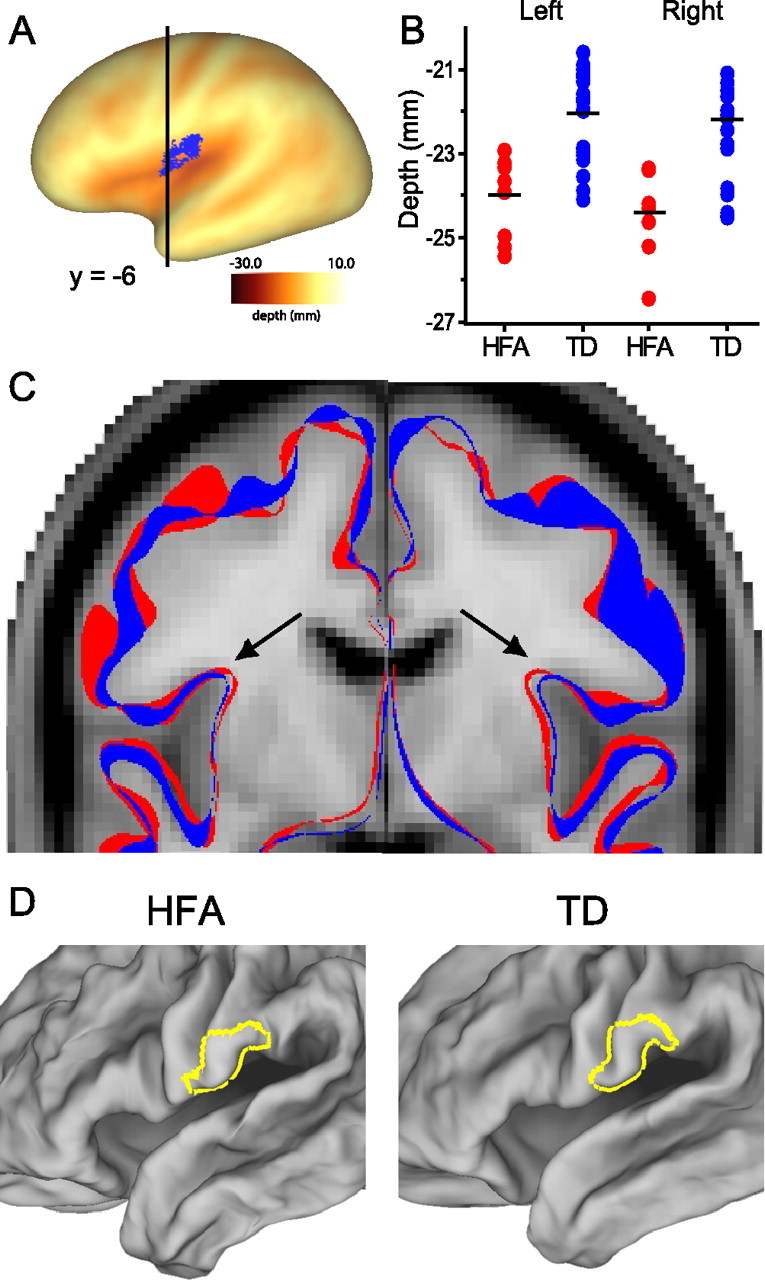
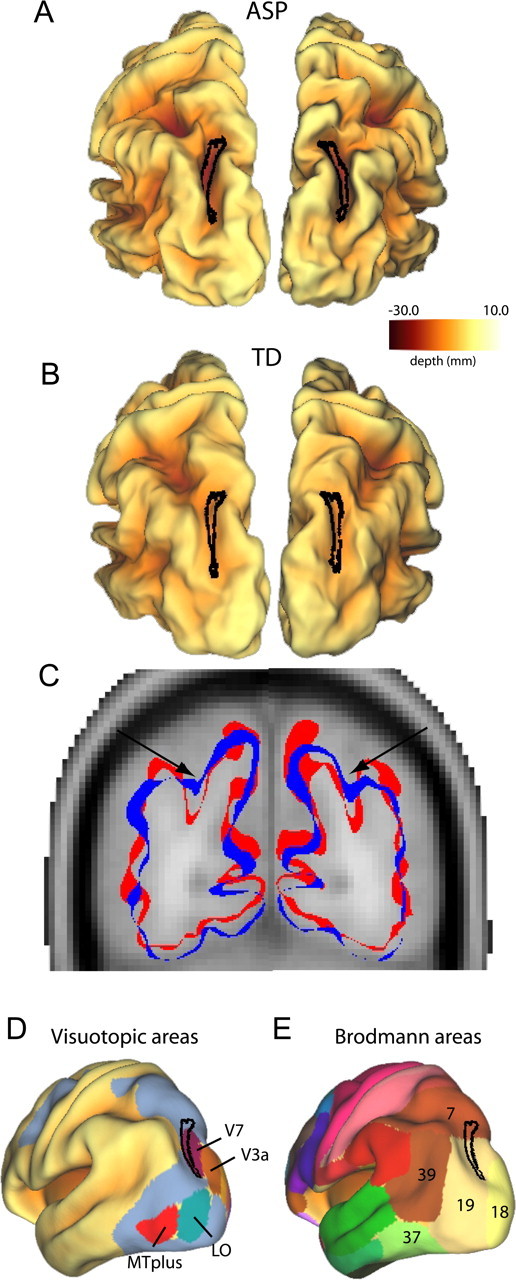
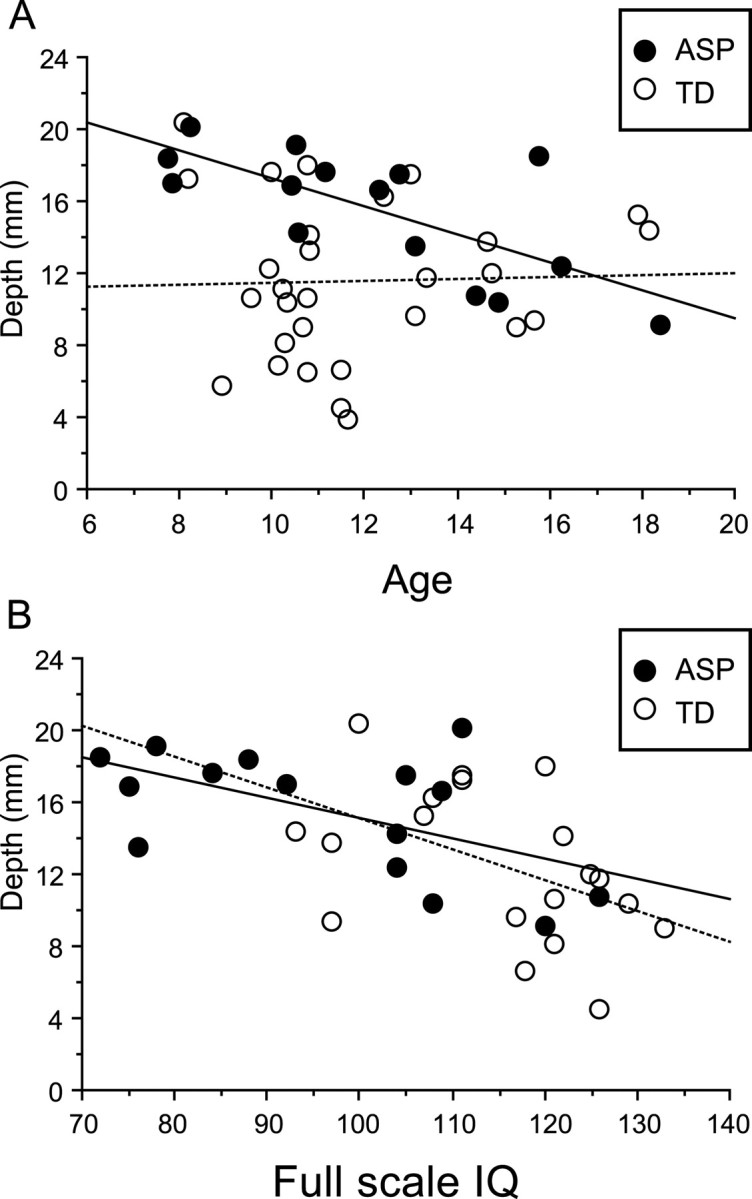
We tested for cortical shape abnormalities using surface-based morphometry across a range of autism spectrum disorders (7.5-18 years of age). We generated sulcal depth maps from structural magnetic resonance imaging data and compared typically developing controls to three autism spectrum disorder subgroups: low-functioning autism, high-functioning autism, and Asperger's syndrome. The low-functioning autism group had a prominent shape abnormality centered on the pars opercularis of the inferior frontal gyrus that was associated with a sulcal depth difference in the anterior insula and frontal operculum. The high-functioning autism group had bilateral shape abnormalities similar to the low-functioning group, but smaller in size and centered more posteriorly, in and near the parietal operculum and ventral postcentral gyrus. Individuals with Asperger's syndrome had bilateral abnormalities in the intraparietal sulcus that correlated with age, intelligence quotient, and Autism Diagnostic Interview-Revised social and repetitive behavior scores. Because of evidence suggesting age-related differences in the developmental time course of neural alterations in autism, separate analyses on children (7.5-12.5 years of age) and adolescents (12.75-18 years of age) were also carried out. All of the cortical shape abnormalities identified across all ages were more pronounced in the children. These findings are consistent with evidence of an altered trajectory of early brain development in autism, and they identify several regions that may have abnormal patterns of connectivity in individuals with autism.
Figures
Similar articles
-
Longitudinal changes in cortical thickness in autism and typical development.Brain. 2014 Jun;137(Pt 6):1799-812. doi: 10.1093/brain/awu083. Epub 2014 Apr 22. Brain. 2014. PMID: 24755274 Free PMC article.
-
Differential effects on white-matter systems in high-functioning autism and Asperger's syndrome.Psychol Med. 2009 Nov;39(11):1885-93. doi: 10.1017/S0033291709005728. Epub 2009 Apr 9. Psychol Med. 2009. PMID: 19356262
-
Distinct patterns of grey matter abnormality in high-functioning autism and Asperger's syndrome.J Child Psychol Psychiatry. 2008 Dec;49(12):1287-95. doi: 10.1111/j.1469-7610.2008.01933.x. Epub 2008 Jul 29. J Child Psychol Psychiatry. 2008. PMID: 18673405
-
Annotation: The similarities and differences between autistic disorder and Asperger's disorder: a review of the empirical evidence.J Child Psychol Psychiatry. 2004 Mar;45(3):421-34. doi: 10.1111/j.1469-7610.2004.00234.x. J Child Psychol Psychiatry. 2004. PMID: 15055363 Review.
-
A clinical and neurobehavioural review of high-functioning autism and Asperger's disorder.Aust N Z J Psychiatry. 2002 Dec;36(6):762-70. doi: 10.1046/j.1440-1614.2002.01097.x. Aust N Z J Psychiatry. 2002. PMID: 12406118 Review.
Cited by
-
Neuroanatomical and neurofunctional markers of social cognition in autism spectrum disorder.Hum Brain Mapp. 2016 Nov;37(11):3957-3978. doi: 10.1002/hbm.23288. Hum Brain Mapp. 2016. PMID: 27329401 Free PMC article.
-
Morphometric Analysis of Brain in Newborn with Congenital Diaphragmatic Hernia.Brain Sci. 2021 Apr 2;11(4):455. doi: 10.3390/brainsci11040455. Brain Sci. 2021. PMID: 33918479 Free PMC article.
-
Divide and Conquer: Sub-Grouping of ASD Improves ASD Detection Based on Brain Morphometry.PLoS One. 2016 Apr 11;11(4):e0153331. doi: 10.1371/journal.pone.0153331. eCollection 2016. PLoS One. 2016. PMID: 27065101 Free PMC article.
-
Regional Alterations in Cortical Sulcal Depth in Living Fetuses with Down Syndrome.Cereb Cortex. 2021 Jan 5;31(2):757-767. doi: 10.1093/cercor/bhaa255. Cereb Cortex. 2021. PMID: 32940649 Free PMC article.
-
Neuroanatomical Alterations in High-Functioning Adults with Autism Spectrum Disorder.Front Neurosci. 2016 Jun 2;10:237. doi: 10.3389/fnins.2016.00237. eCollection 2016. Front Neurosci. 2016. PMID: 27313505 Free PMC article.
References
-
- Abell F, Krams M, Ashburner J, Passingham R, Friston K, Frackowiak R, Happe F, Frith C, Frith U. The neuroanatomy of autism: a voxel-based whole brain analysis of structural scans. NeuroReport. 1999;10:1647–1651. - PubMed
-
- Amunts K, Schleicher A, Burgel U, Mohlberg H, Uylings HB, Zilles K. Broca's region revisited: cytoarchitecture and intersubject variability. J Comp Neurol. 1999;412:319–341. - PubMed
-
- Amunts K, Weiss PH, Mohlberg H, Pieperhoff P, Eickhoff S, Gurd JM, Marshall JC, Shah NJ, Fink GR, Zilles K. Analysis of neural mechanisms underlying verbal fluency in cytoarchitectonically defined stereotaxic space—the roles of Brodmann areas 44 and 45. NeuroImage. 2004;22:42–56. - PubMed
-
- American Psychiatric Association, editor. Ed 4. Washington, DC: American Psychiatric Association; 1994. Diagnostic and statistical manual of mental disorders.
Publication types
MeSH terms
Grants and funding
LinkOut - more resources
Full Text Sources
Other Literature Sources
Medical
Miscellaneous