. 2008 Jan;19(1):352-67.
doi: 10.1091/mbc.e07-08-0779. Epub 2007 Oct 24.

Coordination of growth rate, cell cycle, stress response, and metabolic activity in yeast

Affiliations

Coordination of growth rate, cell cycle, stress response, and metabolic activity in yeast

Matthew J Brauer et al. Mol Biol Cell. 2008 Jan.

Abstract

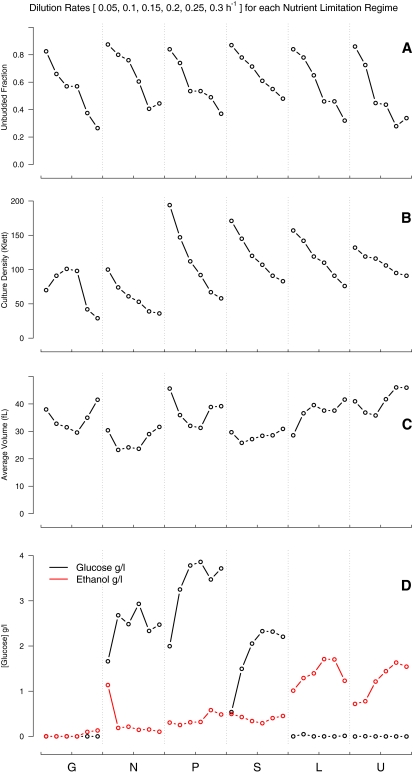
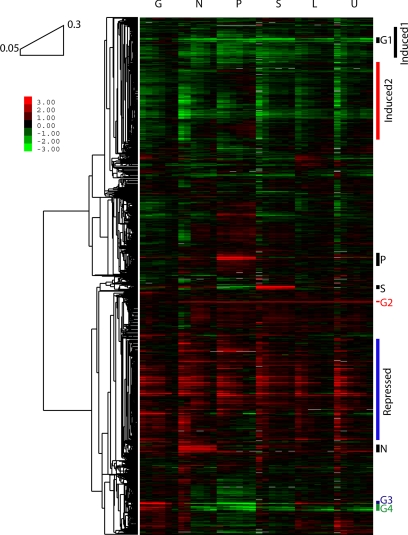
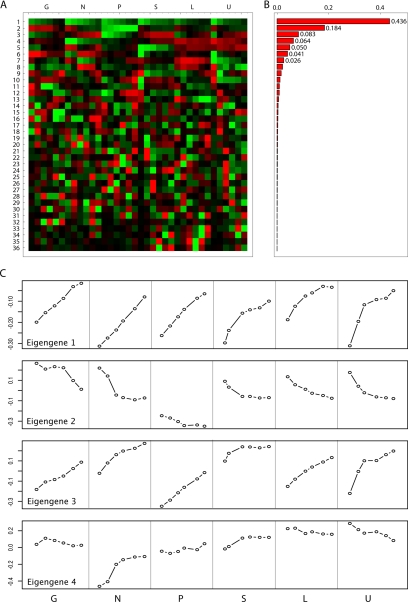
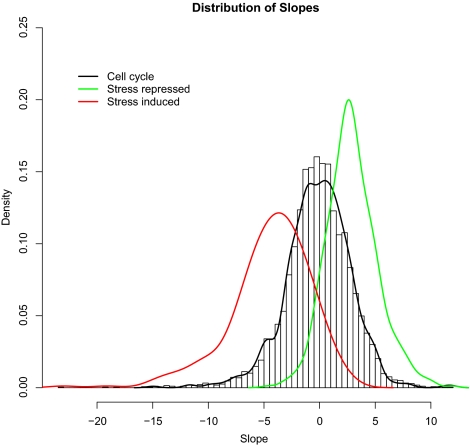
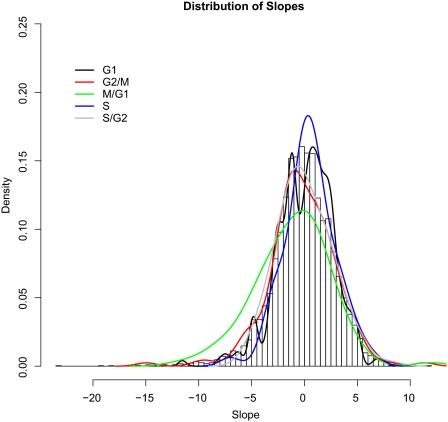
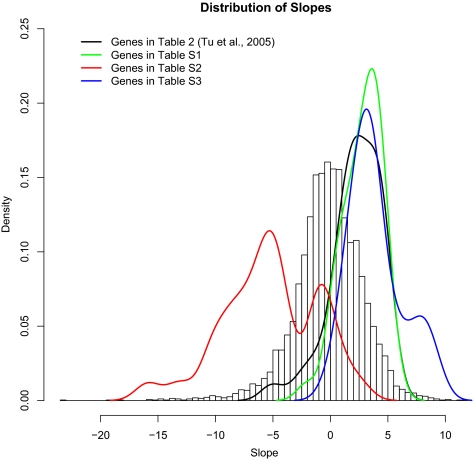
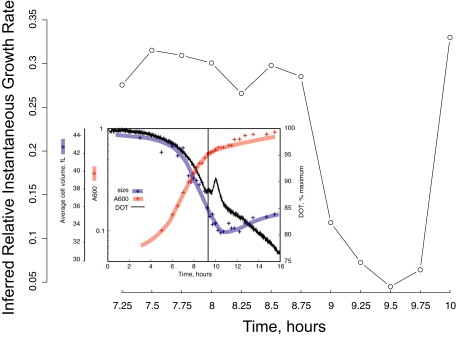
We studied the relationship between growth rate and genome-wide gene expression, cell cycle progression, and glucose metabolism in 36 steady-state continuous cultures limited by one of six different nutrients (glucose, ammonium, sulfate, phosphate, uracil, or leucine). The expression of more than one quarter of all yeast genes is linearly correlated with growth rate, independent of the limiting nutrient. The subset of negatively growth-correlated genes is most enriched for peroxisomal functions, whereas positively correlated genes mainly encode ribosomal functions. Many (not all) genes associated with stress response are strongly correlated with growth rate, as are genes that are periodically expressed under conditions of metabolic cycling. We confirmed a linear relationship between growth rate and the fraction of the cell population in the G0/G1 cell cycle phase, independent of limiting nutrient. Cultures limited by auxotrophic requirements wasted excess glucose, whereas those limited on phosphate, sulfate, or ammonia did not; this phenomenon (reminiscent of the "Warburg effect" in cancer cells) was confirmed in batch cultures. Using an aggregate of gene expression values, we predict (in both continuous and batch cultures) an "instantaneous growth rate." This concept is useful in interpreting the system-level connections among growth rate, metabolism, stress, and the cell cycle.


Figures

Figure 1.
Figure 1.
Measured characteristics of cultures at steady state. Limiting nutrients at bottom of figure. Within each limitation, dilution rates are ordered from 0.05 to 0.3 h−1 in 0.05 h−1 increments. (A) Fraction of unbudded cells. (B) Steady-state culture density in Klett units. (C) Average cell volume. (D) Residual glucose and ethanol levels.
Figure 2.
Figure 2.
Hierarchical clustering of expression values across dilution rates and limiting nutrients. Clustering by Pearson correlation reveals many up- and down-regulated clusters spanning all nutrient limitations (e.g., Induced1, Induced2, Repressed) and few smaller gene groups regulated in a nutrient-specific manner (e.g., G1–G4, P, S, and N). Reference for all samples is from a glucose-limited chemostat at 0.25 h−1. Conditions are as described in Figure 1.
Figure 3.
Figure 3.
SVD decomposition of expression data. Singular value decomposition of the growth rate/nutrient limitation microarray data shows that a large portion of the variation in gene expression (>70%) is related to changes in growth rate. Secondary eigengenes also capture nutrient-specific responses (e.g., phosphate and sulfate). (A) 36 eigengenes. (B) Eigengene weights (eigenvalues). (C) Expression levels of the four most significant eigengenes.
Figure 4.
Figure 4.
Distribution of experimental growth rate responses versus bootstrapped background distribution. A histogram of the estimated regression slopes for 5537 genes is compared with a 100,000-point bootstrapped null distribution of slopes (density estimate; black, solid line) and to the distribution of slopes corresponding to genes that do not respond to growth rate (density estimate; dash-dotted, blue line). The expression responses of genes in our microarray data are significantly broader than expected by chance, whereas genes we determine to be largely unresponsive to changes in growth rate have slopes near zero.
Figure 5.
Figure 5.
Transcriptional response of stress-related and cell cycle-related genes to changes in growth rate. Genes expressed periodically during the cell cycle (black line; Spellman et al., 1998) are distributed essentially as background, whereas genes induced (red line) or repressed (green line) by stress (Gasch et al., 2000) tend to be conversely repressed or induced as growth rate increases.
Figure 6.
Figure 6.
Distribution of growth rate response slopes for genes specific to individual cell cycle phases. A breakdown of cell cycle specific gene response to growth rate by phase shows little variation from background. The 89 genes expressed in the M-G1 phase have a slight tendency to be down-regulated as growth rate increases.
Figure 7.
Figure 7.
Distribution of regression slopes for metabolic cycling conditions of Tu et al. (2005). In our expression data, Tu et al.'s “most periodic” genes during metabolic cycling (their table 2; black line) are induced as growth rate increases, as are their mitochondrial and cytoplasmic ribosomal clusters (their supplemental tables S1 and S3; green and blue lines). Peroxisomal genes (their supplemental table S2; red line) respond bimodally to growth rate, with the majority showing negative correlation and the minority not responding substantially to growth rate (including several stress response genes).
Figure 8.
Figure 8.
Inferred instantaneous growth rates in batch culture undergoing the diauxic shift. The main figure shows the relative growth rates inferred by our linear model from microarray data in Brauer et al. (2005). The inset, from Brauer et al. (2005) demonstrates that their observed variations in cell volume and dissolved oxygen exactly match our predicted cessation of growth as the diauxic shift occurs (∼9.25–9.75 h).

References

    1. Airoldi E. M., Huttenhower C., Gresham D., Botstein D., Troyanskaya O. G. Growth-specific programs of gene expression. Proceedings of the Problems and Methods in Computational Biology Workshop; 2007. NIPS 2007.
    1. Alexander M., Jeffries T. Respiratory efficiency and metabolite partitioning as regulatory phenomena in yeasts. Enzyme Microb. Technol. 1990;12:2–19.
    1. Alter O., Brown P. O., Botstein D. Singular value decomposition for genome-wide expression data processing and modeling. Proc. Natl. Acad. Sci. USA. 2000;97:10101–10106. - PMC - PubMed
    1. Ashburner M., et al. Gene ontology: tool for the unification of biology. The Gene Ontology Consortium. Nat. Genet. 2000;25:25–29. - PMC - PubMed
    1. Benjamini Y., Hochberg Y. Controlling the false discovery rate: a practical and powerful approach to multiple testing. J. R. Stat. Soc. 1995;57:289–300.

Publication types