

Constitutively active Akt induces ectodermal defects and impaired bone morphogenetic protein signaling
- PMID: 17959825
- PMCID: PMC2174171
- DOI: 10.1091/mbc.e07-08-0764
Constitutively active Akt induces ectodermal defects and impaired bone morphogenetic protein signaling
Abstract
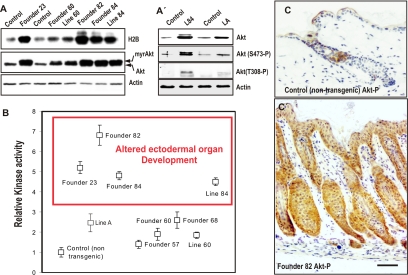
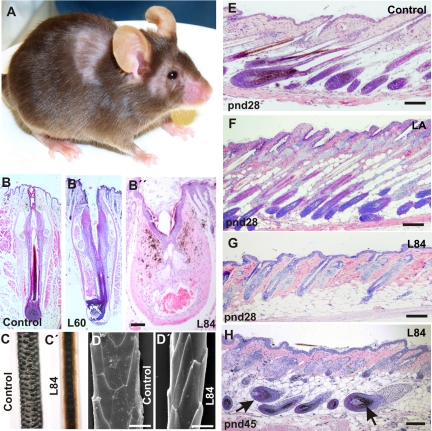
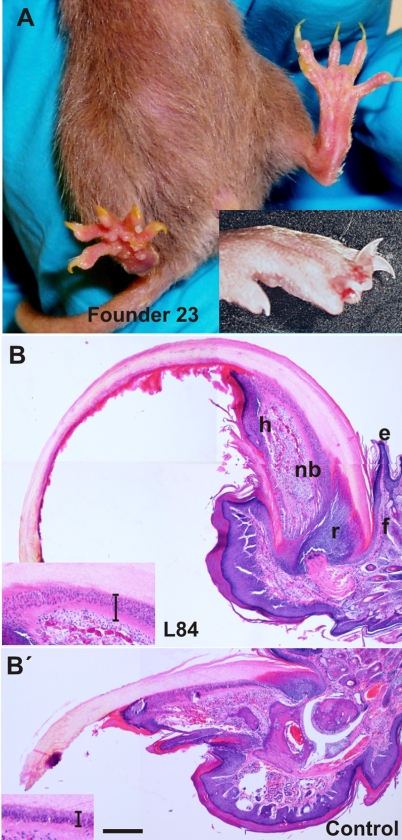
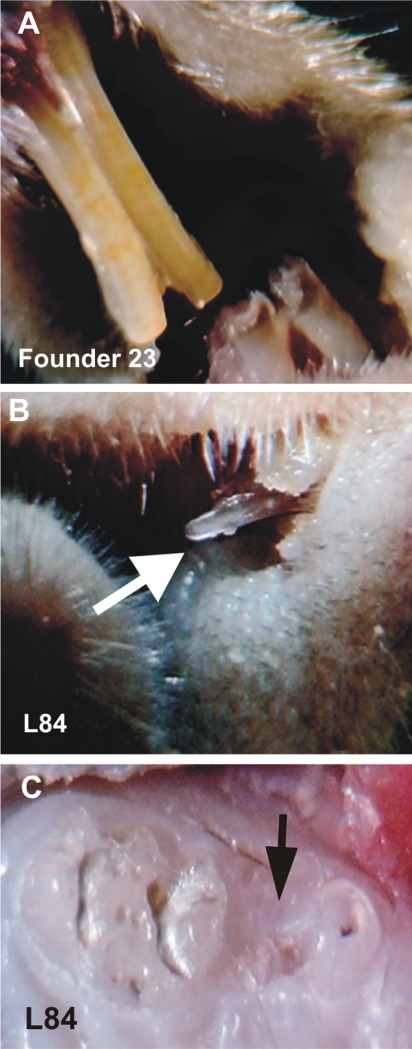
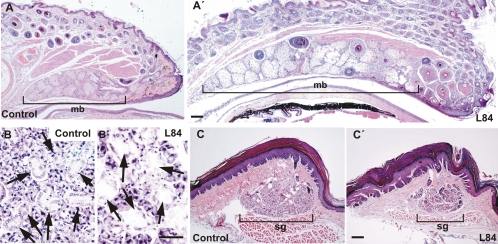
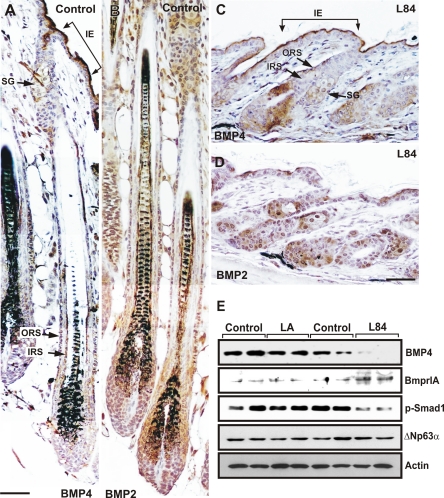
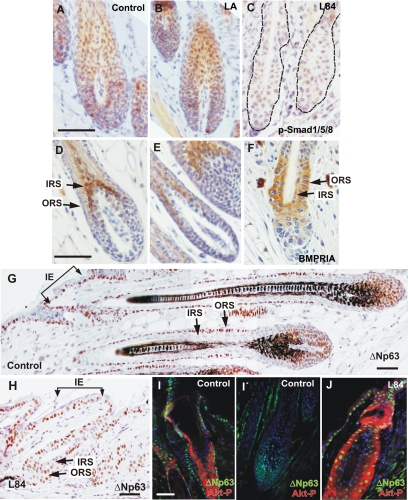
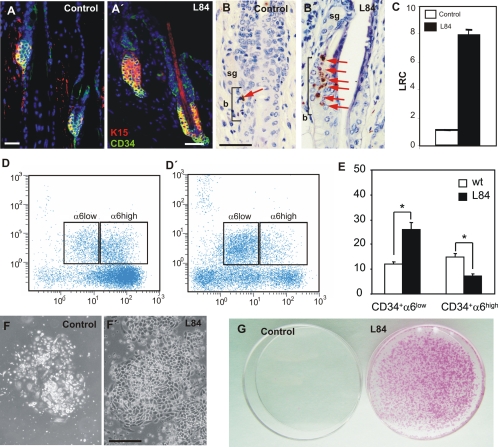
Aberrant activation of the Akt pathway has been implicated in several human pathologies including cancer. However, current knowledge on the involvement of Akt signaling in development is limited. Previous data have suggested that Akt-mediated signaling may be an essential mediator of epidermal homeostasis through cell autonomous and noncell autonomous mechanisms. Here we report the developmental consequences of deregulated Akt activity in the basal layer of stratified epithelia, mediated by the expression of a constitutively active Akt1 (myrAkt) in transgenic mice. Contrary to mice overexpressing wild-type Akt1 (Akt(wt)), these myrAkt mice display, in a dose-dependent manner, altered development of ectodermally derived organs such as hair, teeth, nails, and epidermal glands. To identify the possible molecular mechanisms underlying these alterations, gene profiling approaches were used. We demonstrate that constitutive Akt activity disturbs the bone morphogenetic protein-dependent signaling pathway. In addition, these mice also display alterations in adult epidermal stem cells. Collectively, we show that epithelial tissue development and homeostasis is dependent on proper regulation of Akt expression and activity.
Figures

Similar articles
-
Deregulated activity of Akt in epithelial basal cells induces spontaneous tumors and heightened sensitivity to skin carcinogenesis.Cancer Res. 2007 Nov 15;67(22):10879-88. doi: 10.1158/0008-5472.CAN-07-2564. Cancer Res. 2007. PMID: 18006833
-
Akt signaling leads to stem cell activation and promotes tumor development in epidermis.Stem Cells. 2014 Jul;32(7):1917-28. doi: 10.1002/stem.1669. Stem Cells. 2014. PMID: 24504902
-
Ectoderm-targeted overexpression of the glucocorticoid receptor induces hypohidrotic ectodermal dysplasia.Endocrinology. 2005 Jun;146(6):2629-38. doi: 10.1210/en.2004-1246. Epub 2005 Mar 3. Endocrinology. 2005. PMID: 15746257
-
Pelota Regulates Epidermal Differentiation by Modulating BMP and PI3K/AKT Signaling Pathways.J Invest Dermatol. 2016 Aug;136(8):1664-1671. doi: 10.1016/j.jid.2016.04.020. Epub 2016 May 7. J Invest Dermatol. 2016. PMID: 27164299
-
Akt activation induces epidermal hyperplasia and proliferation of epidermal progenitors.Oncogene. 2007 Jul 19;26(33):4882-8. doi: 10.1038/sj.onc.1210274. Epub 2007 Feb 12. Oncogene. 2007. PMID: 17297448
Cited by
-
PI3K/AKT pathway regulates E-cadherin and Desmoglein 2 in aggressive prostate cancer.Cancer Med. 2015 Aug;4(8):1258-71. doi: 10.1002/cam4.463. Epub 2015 May 29. Cancer Med. 2015. PMID: 26033689 Free PMC article.
-
Establishment of a murine epidermal cell line suitable for in vitro and in vivo skin modelling.BMC Dermatol. 2011 Apr 21;11:9. doi: 10.1186/1471-5945-11-9. BMC Dermatol. 2011. PMID: 21510892 Free PMC article.
-
The development of hair follicles and nail.Dev Biol. 2024 Sep;513:3-11. doi: 10.1016/j.ydbio.2024.05.010. Epub 2024 May 15. Dev Biol. 2024. PMID: 38759942 Free PMC article. Review.
-
The thyroid hormone receptors as modulators of skin proliferation and inflammation.J Biol Chem. 2011 Jul 8;286(27):24079-88. doi: 10.1074/jbc.M111.218487. Epub 2011 May 12. J Biol Chem. 2011. PMID: 21566120 Free PMC article.
-
Hypertrichotic patches as a mosaic manifestation of Proteus syndrome.J Am Acad Dermatol. 2021 Feb;84(2):415-424. doi: 10.1016/j.jaad.2020.01.078. Epub 2020 Feb 7. J Am Acad Dermatol. 2021. PMID: 32035943 Free PMC article.
References
-
- Andl T., et al. Epithelial Bmpr1a regulates differentiation and proliferation in postnatal hair follicles and is essential for tooth development. Development. 2004;131:2257–2268. - PubMed
-
- Bakkers J., Hild M., Kramer C., Furutani-Seiki M., Hammerschmidt M. Zebrafish DeltaNp63 is a direct target of Bmp signaling and encodes a transcriptional repressor blocking neural specification in the ventral ectoderm. Dev. Cell. 2002;2:617–627. - PubMed
-
- Barbieri C. E., Barton C. E., Pietenpol J. A. Delta Np63 alpha expression is regulated by the phosphoinositide 3-kinase pathway. J. Biol. Chem. 2003;278:51408–51414. - PubMed
-
- Begum S., Emani N., Cheung A., Wilkins O., Der S., Hamel P. A. Cell-type-specific regulation of distinct sets of gene targets by Pax3 and Pax3/FKHR. Oncogene. 2005;24:1860–1872. - PubMed
-
- Bellacosa A., Kumar C. C., Di Cristofano A., Testa J. R. Activation of AKT kinases in cancer: implications for therapeutic targeting. Adv. Cancer Res. 2005;94:29–86. - PubMed
Publication types
MeSH terms
Substances
Grants and funding
LinkOut - more resources
Full Text Sources
Molecular Biology Databases
Miscellaneous
