. 2007 Dec;13(12):2213-23.
doi: 10.1261/rna.689007. Epub 2007 Oct 24.

An Hfq-like protein in archaea: crystal structure and functional characterization of the Sm protein from Methanococcus jannaschii

Affiliations

An Hfq-like protein in archaea: crystal structure and functional characterization of the Sm protein from Methanococcus jannaschii

Jesper S Nielsen et al. RNA. 2007 Dec.

Abstract

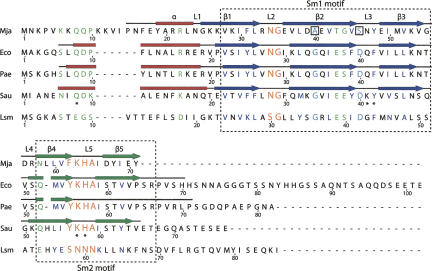
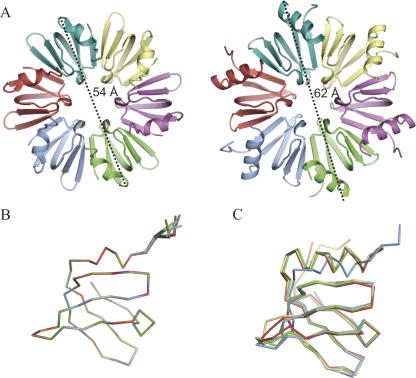
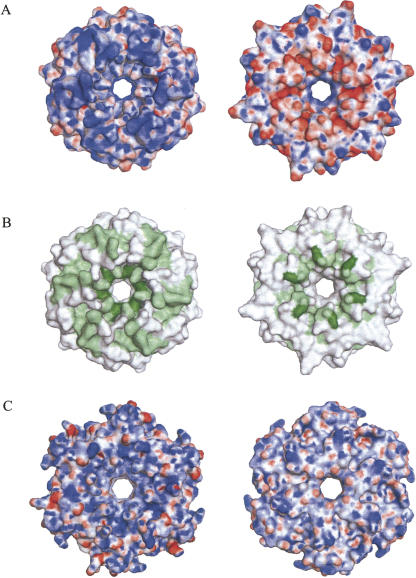
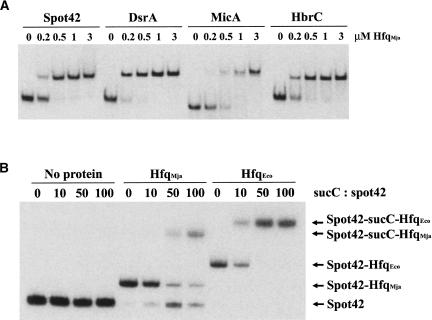
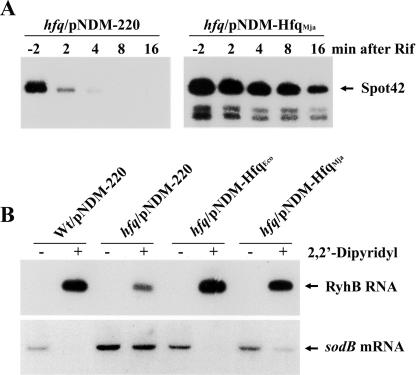
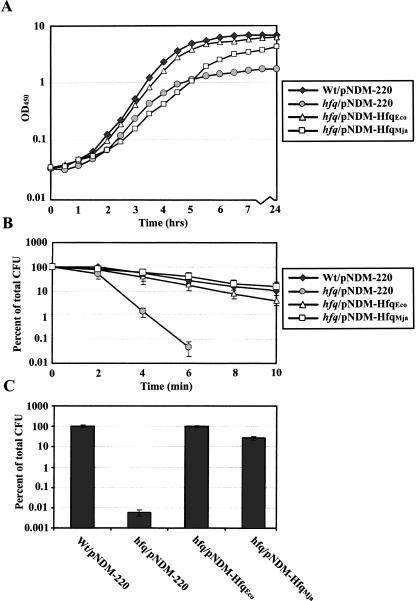
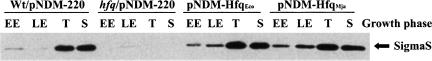
The Sm and Sm-like proteins are conserved in all three domains of life and have emerged as important players in many different RNA-processing reactions. Their proposed role is to mediate RNA-RNA and/or RNA-protein interactions. In marked contrast to eukaryotes, bacteria appear to contain only one distinct Sm-like protein belonging to the Hfq family of proteins. Similarly, there are generally only one or two subtypes of Sm-related proteins in archaea, but at least one archaeon, Methanococcus jannaschii, encodes a protein that is related to Hfq. This archaeon does not contain any gene encoding a conventional archaeal Sm-type protein, suggesting that Hfq proteins and archaeal Sm-homologs can complement each other functionally. Here, we report the functional characterization of M. jannaschii Hfq and its crystal structure at 2.5 A resolution. The protein forms a hexameric ring. The monomer fold, as well as the overall structure of the complex is similar to that found for the bacterial Hfq proteins. However, clear differences are seen in the charge distribution on the distal face of the ring, which is unusually negative in M. jannaschii Hfq. Moreover, owing to a very short N-terminal alpha-helix, the overall diameter of the archaeal Hfq hexamer is significantly smaller than its bacterial counterparts. Functional analysis reveals that Escherichia coli and M. jannaschii Hfqs display very similar biochemical and biological properties. It thus appears that the archaeal and bacterial Hfq proteins are largely functionally interchangeable.


Figures

FIGURE 1.
FIGURE 1.
Hfq sequence alignment. Alignment of the sequence of Mja-Hfq (Mja) with those bacteria homologous for which a structure has been determined, E. coli (Eco), P. aeruginosa (Pae), and S. aureus (Sau), as well as the Saccharomyces cerevisiae Sm-like (Lsm) protein. The location of the Sm1 and Sm2 sequence motifs is indicated by dashed boxes, and the secondary structure observed in the four structures is indicated above its corresponding sequence, with helices (α) as red boxes and sheets (β1–β5) as dark blue (Sm1) or green (Sm2) arrows. The loops (L1–L5) are shown as lines. In the sequence alignment, partly conserved residues or residues with conserved functionality are shown in green. Highly conserved hydrophobic residues found in all Sm/Lsm proteins are indicated with dark blue letters and residues in loops L3 and L5 that form the nucleotide-binding pockets in the structure of the S. aureus Hfq–RNA complex are labeled with a star. Two of the most conserved residues amongst Hfq and Sm proteins, a glycine (G) and an aspartic acid (D) residue within the Sm1 domain (indicated with cyan), are replaced by alanine (A) and serine (S), respectively, in Mja-Hfq (boxed). The two Hfq signature motifs, the Sm1 NG and Sm2 Y(F)KHA motif, are shown with orange letters. The alignment figure was produced using SecSeq (D.E. Brodersen, unpubl. software, http://www.bioxray.au.dk/∼deb/secseq).
FIGURE 2.
FIGURE 2.
Overview of the Mja-Hfq structure. (A) Views of the proximal side of the M. jannaschii (left) and E. coli (PDB ID 1HK9, right) Hfq hexamers. The maximum diameters of the two rings, 54 Å and 62 Å, respectively, are indicated. (B) Superposition of all 12 monomers of Mja-Hfq present in the ASU. (C) Superposition of the structures of Eco-Hfq (red), Pae-Hfq (yellow), and Sau-Hfq (green) onto Mja-Hfq (blue). The figures were prepared using PyMOL (DeLano 2002).
FIGURE 3.
FIGURE 3.
Surface properties of Hfq. (A) Electrostatic potential mapped onto the surface of Mja-Hfq as seen from the proximal (left) and distal (right) sides. Dark blue corresponds to +25 kbT/ec and dark red to –25 kbT/ec. Surface potentials were calculated with APBS (Adaptive Poisson–Boltzmann Solver) (Baker et al. 2001) and visualized using PyMOL (DeLano 2002). (B) Conserved residues in the alignment of Mja-Hfq with the bacterial homologs mapped on the surface of Mja-Hfq in the same views as in A. Dark-green residues are identical, light-green residues are conserved in >70% of the sequences and white residues are conserved in <70% of the sequences. (C) Surface potential observed for the bacterial Hfq from E. coli (PDB ID 1HK9) in the proximal (left) and distal (right) views.
FIGURE 4.
FIGURE 4.
RNA-binding by Mja-Hfq in vitro. (A) Mja-Hfq binding to specific sRNAs from E. coli. 32P-labeled transcript of the sRNAs (4 nM final concentration) and 2 μM of tRNA were incubated with increasing amounts of the Mja-Hfq protein and complex formation was monitored in an electrophoretic mobility-shift experiment. (B) Mja-Hfq facilitates RNA–RNA interaction in vitro. Incubation of 32P-labeled Spot 42 RNA (5 nM), 2 μM tRNA, and increasing amounts of unlabeled suc′-RNA substrate in the absence (lanes 1–4) or presence of either 2 μM Mja-Hfq (lanes 5–8) or 2 μM Eco-Hfq (lanes 9–12). Complex formation was monitored in an electrophoretic mobility shift experiment. Unbound Spot 42 RNA and the various complexes formed are indicated next to the gel.
FIGURE 5.
FIGURE 5.
Function of Mja-Hfq in E. coli in vivo. (A) Stabilization of Spot 42 RNA by Mja-Hfq. Exponential grown cultures of IPTG-induced (1 mM) cells of SØ928 hfq1∷kan carrying either pNDM-220 (control) or pNDM-hfqMja were treated with rifampicin to block new transcription. Samples were taken at the indicated times and total RNA was extracted. Spot 42 RNA levels were analyzed by Northern blot analysis. (B) Mja-Hfq cooperates in sRNA-mediated regulation of mRNA turnover. Cells of wild-type (SØ928) carrying pNDM-220 (empty vector) and the hfq1∷kan mutant transformed with pNDM-200, pNDM-hfqEco, or pNDM-hfqMja were grown in LB medium containing 1 mM IPTG at 37°C. At an OD600 of 0.4, each of the cultures was split and 2,2′-dipyridyl was added to one culture. After 10 min, samples were harvested, total RNA was extracted, and RyhB RNA and sodB mRNA levels were analyzed by Northern blot analysis.
FIGURE 6.
FIGURE 6.
Complementation of hfq phenotypes by Mja-Hfq. (A) Growth phenotype. Growth curves of the parent strain (SØ928) carrying pNDM-220 (empty vector) and the hfq1::kan mutant transformed with pNDM-220, pNDM-hfqEco, or pNDM-hfqMja in LB medium containing 1 mM IPTG and 30 μg/mL ampicillin. (B) Thermotolerance of stationary-phase cells; 0.1 mL samples of overnight cultures of the four strains were incubated at 55°C for 0–10 min and then placed on ice. The number of colony-forming units (CFU)/mL of cultures was determined by plating dilutions on LB plates containing 30 μg/mL ampicillin and 1 mM IPTG and counting colonies overnight incubation. (C) Acid stress resistance of stationary-phase cells. Samples of overnight cultures of the four strains were diluted 100-fold in either LB medium (control) or acidic LB (pH 3, adjusted with HCl) and then incubated 1 h at 37°C. Surviving colony-forming units were determined as described in B. The growth and stress experiments were performed three times with similar results.
FIGURE 7.
FIGURE 7.
The Mja-Hfq protein can functionally replace E. coli Hfq in rpoS translation. The wild-type/pNDM-220 strain and the hfq1∷kan strain transformed with pNDM-220, pNDM-hfqEco, and pNDM-hfqMja, respectively, were cultivated in LB medium containing 1 mM IPTG and 30 μg/mL ampicillin. Cells were harvested at various time points after inoculation, and quantitative Western analysis was done on equal amounts of cells to determine the relative σS levels at each point during growth. (EE) Early-log cells; (LE) late-log cells; (T) cells at transition to stationary phase; (S) stationary phase cells.

References

    1. Adams, P.D., Grosse-Kunstleve, R.W., Hung, L.-W., Ioerger, T.R., McCoy, A.J., Moriarty, N.W., Read, R.J., Sacchettini, J.C., Sauter, N.K., Terwilliger, T.C. PHENIX: Building new software for automated crystallographic structure determination. Acta Crystallogr. 2002;D58:1948–1954. - PubMed
    1. Aiba, H. Mechanism of RNA silencing by Hfq-binding small RNAs. Curr. Opin. Microbiol. 2007;10:134–139. - PubMed
    1. Baker, N.A., Sept, D., Joseph, S., Holst, M.J., McCammon, J.A. Electrostatics of nanosystems: Application to microtubules and the ribosome. Proc. Natl. Acad. Sci. 2001;98:10037–10041. - PMC - PubMed
    1. Beggs, J. Lsm proteins and RNA processing. Biochem. Soc. Trans. 2005;33:433–438. - PubMed
    1. Brennan, R.G., Link, T.M. Hfq structure, function and ligand binding. Curr. Opin. Microbiol. 2007;10:125–133. - PubMed

Publication types

MeSH terms

LinkOut - more resources