

Supra-molecular association and polymorphic behaviour in systems containing bile acid salts
- PMID: 17960084
- PMCID: PMC6149132
- DOI: 10.3390/12081731
Supra-molecular association and polymorphic behaviour in systems containing bile acid salts
Abstract
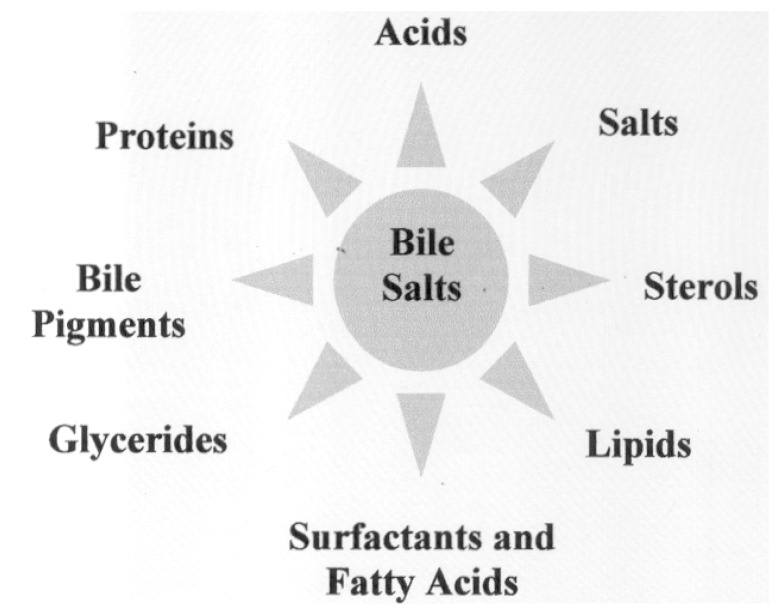
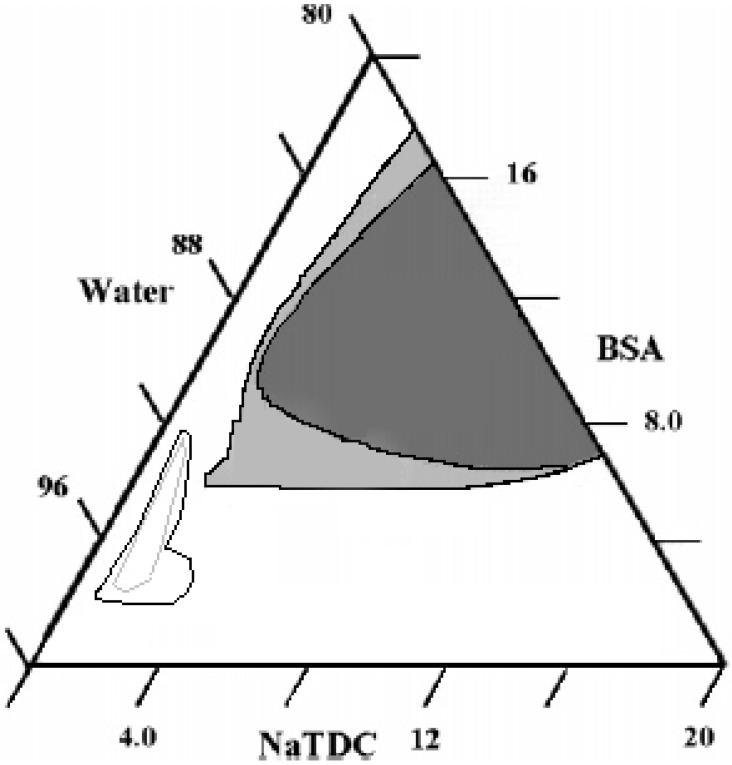
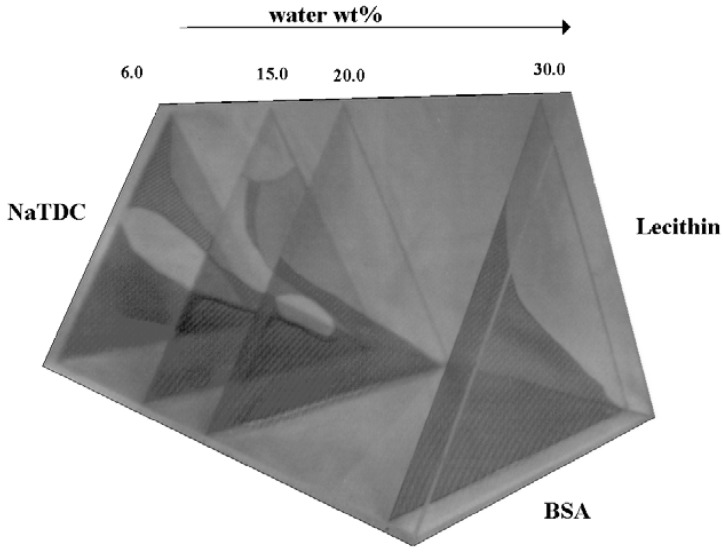
A wide number of supra-molecular association modes are observed in mixtures containing water and bile salts, BS, (with, eventually, other components). Molecular or micellar solutions transform into hydrated solids, fibres, lyotropic liquid crystals and/or gels by raising the concentration, the temperature, adding electrolytes, surfactants, lipids and proteins. Amorphous or ordered phases may be formed accordingly. The forces responsible for this very rich polymorphism presumably arise from the unusual combination of electrostatic, hydrophobic and hydrogen-bond contributions to the system stability, with subsequent control of the supra-molecular organisation modes. The stabilising effect due to hydrogen bonds does not occur in almost all surfactants or lipids and is peculiar to bile acids and salts. Some supra-molecular organisation modes, supposed to be related to malfunctions and dis-metabolic diseases in vivo, are briefly reported and discussed.
Figures
Similar articles
-
pKa values of hyodeoxycholic and cholic acids in the binary mixed micelles sodium-hyodeoxycholate-Tween 40 and sodium-cholate-Tween 40: Thermodynamic stability of the micelle and the cooperative hydrogen bond formation with the steroid skeleton.Steroids. 2017 Jan;117:62-70. doi: 10.1016/j.steroids.2016.09.012. Epub 2016 Sep 17. Steroids. 2017. PMID: 27651024
-
Mixtures of lecithin and bile salt can form highly viscous wormlike micellar solutions in water.Langmuir. 2014 Sep 2;30(34):10221-30. doi: 10.1021/la502380q. Epub 2014 Aug 21. Langmuir. 2014. PMID: 25121460
-
Chemometric and conformational approach to the analysis of the aggregation capabilities in a set of bile salts of the allo and normal series.J Pharm Biomed Anal. 2016 Mar 20;121:316-324. doi: 10.1016/j.jpba.2015.12.030. Epub 2015 Dec 22. J Pharm Biomed Anal. 2016. PMID: 26746785
-
Bile salts in digestion and transport of lipids.Adv Colloid Interface Sci. 2019 Dec;274:102045. doi: 10.1016/j.cis.2019.102045. Epub 2019 Oct 17. Adv Colloid Interface Sci. 2019. PMID: 31689682 Review.
-
Bile acid solubility and precipitation in vitro and in vivo: the role of conjugation, pH, and Ca2+ ions.J Lipid Res. 1992 May;33(5):617-26. J Lipid Res. 1992. PMID: 1619357 Review.
Cited by
-
Gallstone-Formation-Inspired Bimetallic Supra-nanostructures for Computed-Tomography-Image-Guided Radiation Therapy.ACS Appl Nano Mater. 2018 Sep 28;1(9):4602-4611. doi: 10.1021/acsanm.8b00908. Epub 2018 Aug 6. ACS Appl Nano Mater. 2018. PMID: 34056557 Free PMC article.
-
The effect of hydroxyl moieties and their oxosubstitution on bile acid association studied in floating monolayers.ScientificWorldJournal. 2014;2014:152972. doi: 10.1155/2014/152972. Epub 2014 Dec 25. ScientificWorldJournal. 2014. PMID: 25685831 Free PMC article.
-
Partitioning into Colloidal Structures of Fasted State Intestinal Fluid Studied by Molecular Dynamics Simulations.Langmuir. 2016 Dec 6;32(48):12732-12740. doi: 10.1021/acs.langmuir.6b03008. Epub 2016 Nov 28. Langmuir. 2016. PMID: 27934534 Free PMC article.
-
Mixed micelles of sodium cholate and sodium dodecylsulphate 1:1 binary mixture at different temperatures--experimental and theoretical investigations.PLoS One. 2014 Jul 8;9(7):e102114. doi: 10.1371/journal.pone.0102114. eCollection 2014. PLoS One. 2014. PMID: 25004142 Free PMC article.
-
Comparison of solubilization capacity of resveratrol in sodium 3α, 12α -dihydroxy-7-oxo-5 β-cholanoate and sodium dodecyl sulfate.ScientificWorldJournal. 2014 Jan 29;2014:265953. doi: 10.1155/2014/265953. eCollection 2014. ScientificWorldJournal. 2014. PMID: 24688374 Free PMC article.
References
-
- Sanchez-Mete L., Attili A. F. Cholelithiasis: genetic hypothesis. Minerva Gastroenterol. Dietol. 2000;46:45–55. - PubMed
Publication types
MeSH terms
Substances
LinkOut - more resources
Full Text Sources
