

Determinants of renal volume in autosomal-dominant polycystic kidney disease
- PMID: 17960141
- PMCID: PMC2790405
- DOI: 10.1038/sj.ki.5002624
Determinants of renal volume in autosomal-dominant polycystic kidney disease
Abstract
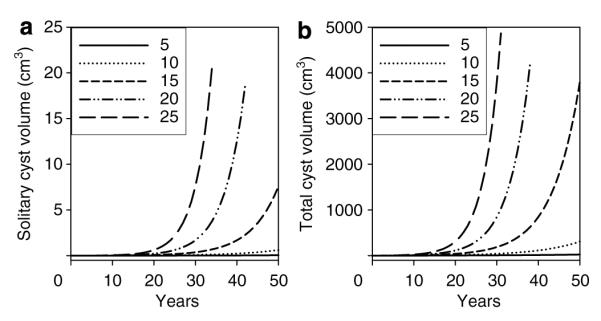
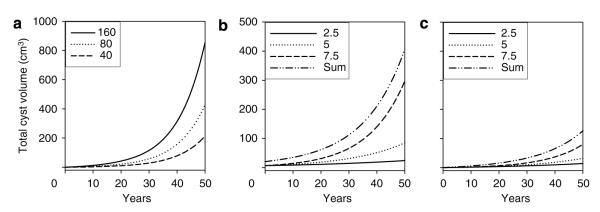
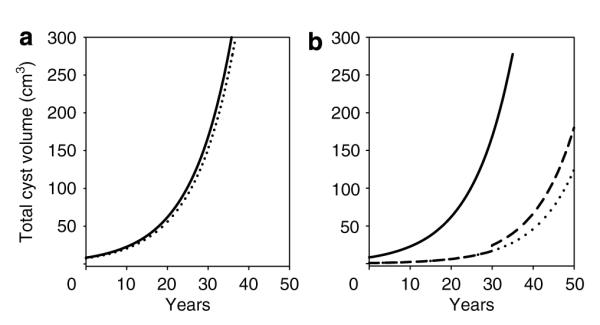
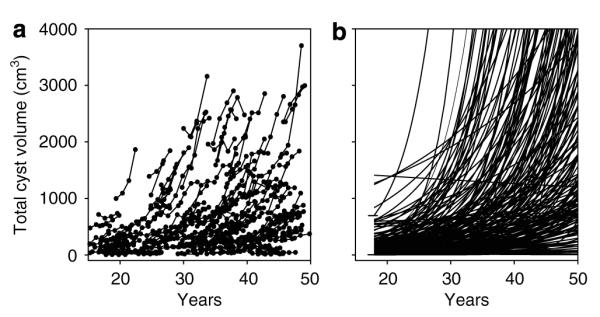
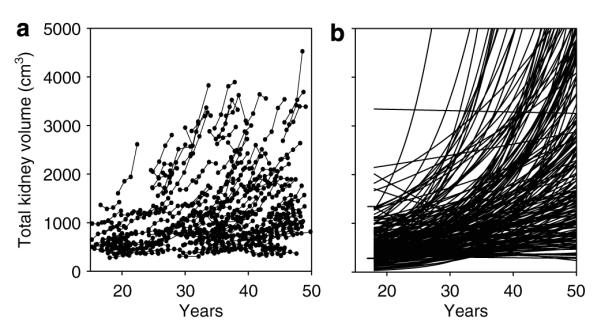
The Consortium of Radiologic Imaging Studies of Polycystic Kidney Disease (CRISP) recently showed that renal enlargement in autosomal-dominant polycystic kidney disease mimicked exponential growth. We determined the effects of cyst initiation rate, total number, and growth rate on the time-dependent change of total cyst volume (TCV). Mathematical models with equations integrating cyst surface area, volume, and an invariant growth rate constant were used to compute the time-dependent change in volume of solitary and multiple cysts. Multiple expanding cysts increased TCV in an exponential-like pattern even when individual cysts formed at different rates or exhibited different but constant growth rates. TCV depended on the rate of cyst initiation and on the total number of cysts; however, the compounding effect of exponential-like growth was the most powerful determinant of long-term cyst expansion. Extrapolation of TCV data plots for individual subjects back to an age of 18 predicted TCV values within an established range. We conclude that cysts started early in life were the main contributor to eventual TCV while their growth rate primarily determined renal size; although the rate of formation and the ultimate number of cysts also contributed. The good fit between the exponential models and the extrapolated CRISP data indicates that the TCV growth rate is a defining trait for individual patients and may be used as a prognostic marker.
Figures
References
-
- Chapman AB, Guay-Woodford LM, Grantham JJ, et al. Renal structure in early autosomal-dominant polycystic kidney disease (ADPKD): the consortium for radiologic imaging studies of polycystic kidney disease (CRISP) cohort. Kidney Int. 2003;64:1035–1045. - PubMed
-
- Grantham JJ, Chapman AB, Torres VE. Volume progression in autosomal dominant polycystic kidney disease: the major factor determining clinical outcomes. Clin J Am Soc Nephrol. 2006;1:148–157. - PubMed
-
- Harris PC, Torres VE. Understanding pathogenic mechanisms in polycystic kidney disease provides clues for therapy. Curr Opin Nephrol Hypertens. 2006;15:456–463. - PubMed
-
- Jeffery S, Saggar-Malik AK, Economides DL, et al. Apparent normalisation of fetal renal size in autosomal dominant polycystic kidney disease (PKD1) Clin Genet. 1998;53:303–307. - PubMed
Publication types
MeSH terms
Grants and funding
- U01 DK056956/DK/NIDDK NIH HHS/United States
- U01 DK056957/DK/NIDDK NIH HHS/United States
- M01 RR000039/RR/NCRR NIH HHS/United States
- M01 RR 00585/RR/NCRR NIH HHS/United States
- M01 RR023940/RR/NCRR NIH HHS/United States
- M01 RR000052/RR/NCRR NIH HHS/United States
- DK 56943/DK/NIDDK NIH HHS/United States
- M01 RR000585/RR/NCRR NIH HHS/United States
- DK 56961/DK/NIDDK NIH HHS/United States
- M01 RR 023940/RR/NCRR NIH HHS/United States
- M01 RR 00039/RR/NCRR NIH HHS/United States
- M01 RR 00052/RR/NCRR NIH HHS/United States
- U01 DK056943/DK/NIDDK NIH HHS/United States
- DK 56957/DK/NIDDK NIH HHS/United States
- UL1 TR000454/TR/NCATS NIH HHS/United States
- U01 DK056961/DK/NIDDK NIH HHS/United States
- DK 56956/DK/NIDDK NIH HHS/United States
LinkOut - more resources
Full Text Sources
