

Fusion viewer: a new tool for fusion and visualization of multimodal medical data sets
- PMID: 17960461
- PMCID: PMC3043878
- DOI: 10.1007/s10278-007-9082-z
Fusion viewer: a new tool for fusion and visualization of multimodal medical data sets
Abstract
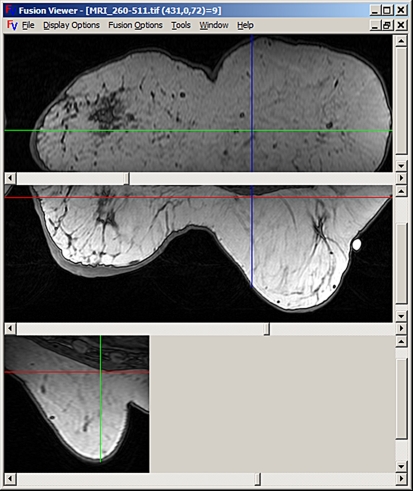
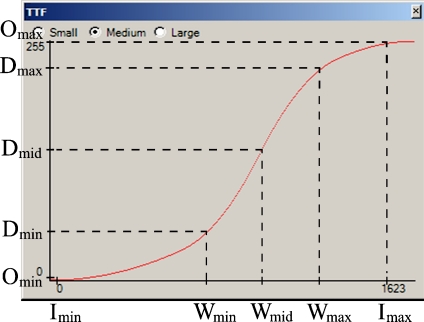
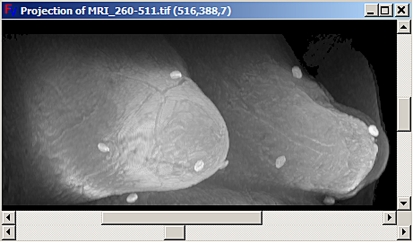
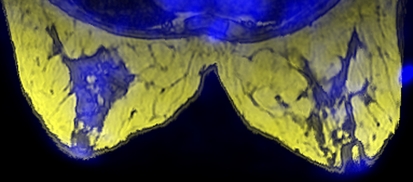
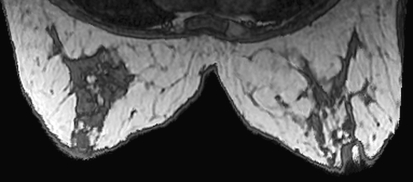
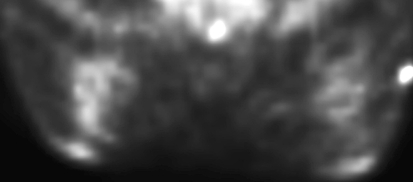
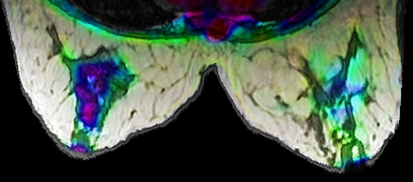
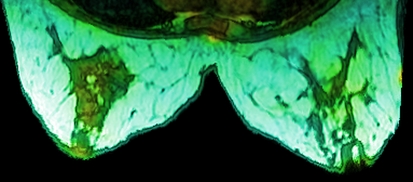
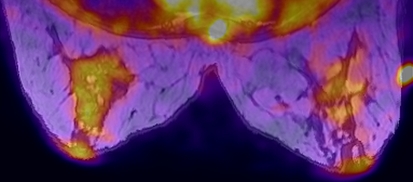
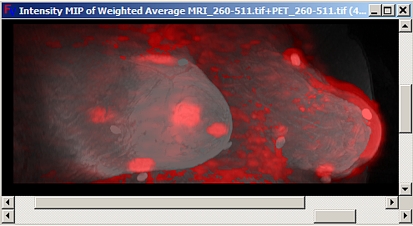
A new application, Fusion Viewer, available for free, has been designed and implemented with a modular object-oriented design. The viewer provides both traditional and novel tools to fuse 3D data sets such as CT (computed tomography), MRI (magnetic resonance imaging), PET (positron emission tomography), and SPECT (single photon emission tomography) of the same subject, to create maximum intensity projections (MIP) and to adjust dynamic range. In many situations, it is desirable and advantageous to acquire biomedical images in more than one modality. For example, PET can be used to acquire functional data, whereas MRI can be used to acquire morphological data. In some situations, a side-by-side comparison of the images provides enough information, but in most of the cases it may be necessary to have the exact spatial relationship between the modalities presented to the observer. To accomplish this task, the images need to first be registered and then combined (fused) to create a single image. In this paper, we discuss the options for performing such fusion in the context of multimodal breast imaging. Additionally, a novel spline-based dynamic range technique is presented in detail. It has the advantage of obtaining a high level of contrast in the intensity range of interest without discarding the intensity information outside of this range while maintaining a user interface similar to the standard window/level windowing procedure.
Figures
Similar articles
-
Phantom validation of coregistration of PET and CT for image-guided radiotherapy.Med Phys. 2004 May;31(5):1083-92. doi: 10.1118/1.1688041. Med Phys. 2004. PMID: 15191296
-
PET/CT image navigation and communication.J Nucl Med. 2004 Jan;45 Suppl 1:46S-55S. J Nucl Med. 2004. PMID: 14736835 Review.
-
A dual modality approach to quantitative quality control in emission tomography.Phys Med Biol. 2005 Aug 7;50(15):N187-94. doi: 10.1088/0031-9155/50/15/N03. Epub 2005 Jul 19. Phys Med Biol. 2005. PMID: 16030376
-
Data-fusion display system with volume rendering of intraoperatively scanned CT images.Med Image Comput Comput Assist Interv. 2005;8(Pt 2):559-66. doi: 10.1007/11566489_69. Med Image Comput Comput Assist Interv. 2005. PMID: 16686004
-
Dual-modality imaging: combining anatomy and function.J Nucl Med. 2008 Jun;49(6):938-55. doi: 10.2967/jnumed.108.051276. Epub 2008 May 15. J Nucl Med. 2008. PMID: 18483101 Review.
Cited by
-
Evaluation of novel genetic algorithm generated schemes for positron emission tomography (PET)/magnetic resonance imaging (MRI) image fusion.J Digit Imaging. 2011 Dec;24(6):1031-43. doi: 10.1007/s10278-011-9382-1. J Digit Imaging. 2011. PMID: 21479733 Free PMC article.
-
Performance Evaluation of Color Models in the Fusion of Functional and Anatomical Images.J Med Syst. 2016 May;40(5):122. doi: 10.1007/s10916-016-0478-5. Epub 2016 Apr 1. J Med Syst. 2016. PMID: 27037686
-
Dynamic curvature topography for evaluating the anterior corneal surface change with Corvis ST.Biomed Eng Online. 2015 Jun 4;14:53. doi: 10.1186/s12938-015-0036-2. Biomed Eng Online. 2015. PMID: 26040948 Free PMC article.
-
2D/3D image fusion of X-ray mammograms with breast MRI: visualizing dynamic contrast enhancement in mammograms.Int J Comput Assist Radiol Surg. 2012 May;7(3):339-48. doi: 10.1007/s11548-011-0623-z. Epub 2011 Jun 5. Int J Comput Assist Radiol Surg. 2012. PMID: 21643945
-
Visual analytics of brain networks.Neuroimage. 2012 May 15;61(1):82-97. doi: 10.1016/j.neuroimage.2012.02.075. Epub 2012 Mar 5. Neuroimage. 2012. PMID: 22414991 Free PMC article.
References
-
- Drolon H: FreeImage. Available at http://freeimage.sourceforge.net/. Accessed on 29 October 2006
-
- Drolon H: FreeImage Documentation, Library Version 3.9.2, Oct. 29, 2006
-
- Jin Y, Fayad L, Laine A. Contrast enhancement by multi-scale adaptive histogram equalization. Wavelets: Applications in signal and image processing. Proc SPIE Int Soc Opt Eng. 2000;4478:206–213.
Publication types
MeSH terms
LinkOut - more resources
Full Text Sources
Other Literature Sources
