

Estimating genealogies from linked marker data: a Bayesian approach
- PMID: 17961219
- PMCID: PMC2233650
- DOI: 10.1186/1471-2105-8-411
Estimating genealogies from linked marker data: a Bayesian approach
Abstract
Background: Answers to several fundamental questions in statistical genetics would ideally require knowledge of the ancestral pedigree and of the gene flow therein. A few examples of such questions are haplotype estimation, relatedness and relationship estimation, gene mapping by combining pedigree and linkage disequilibrium information, and estimation of population structure.
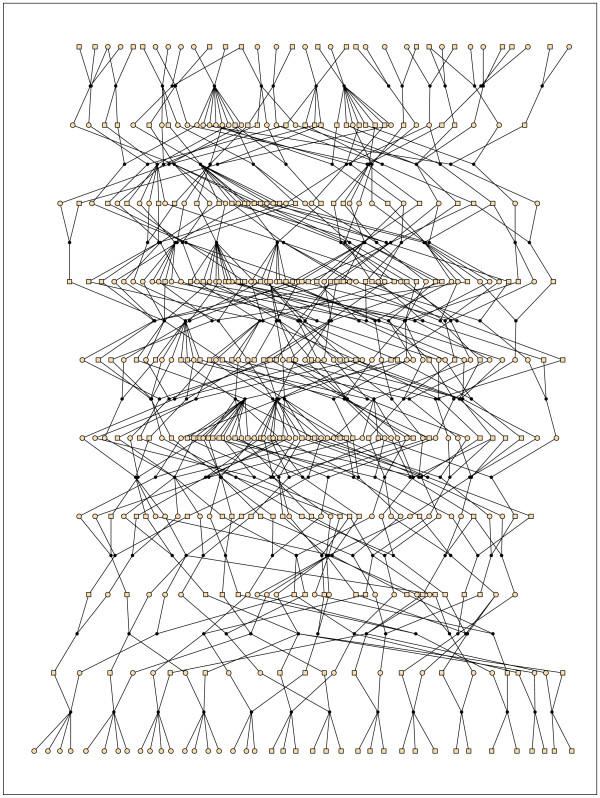
Results: We present a probabilistic method for genealogy reconstruction. Starting with a group of genotyped individuals from some population isolate, we explore the state space of their possible ancestral histories under our Bayesian model by using Markov chain Monte Carlo (MCMC) sampling techniques. The main contribution of our work is the development of sampling algorithms in the resulting vast state space with highly dependent variables. The main drawback is the computational complexity that limits the time horizon within which explicit reconstructions can be carried out in practice.
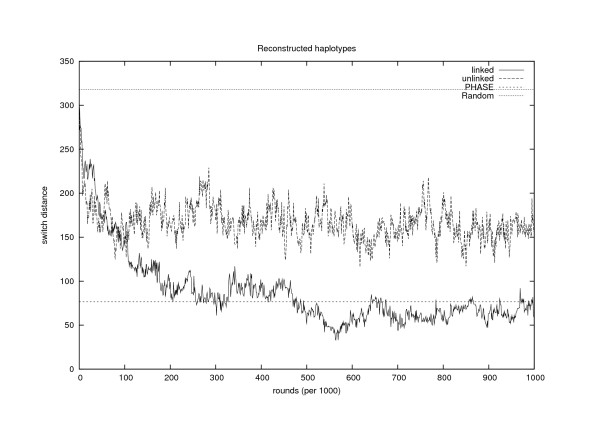
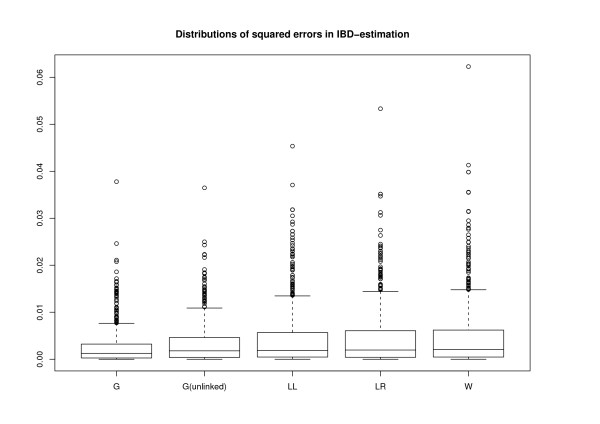
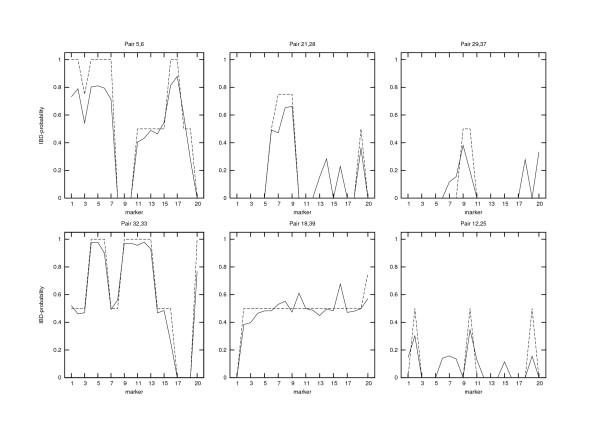
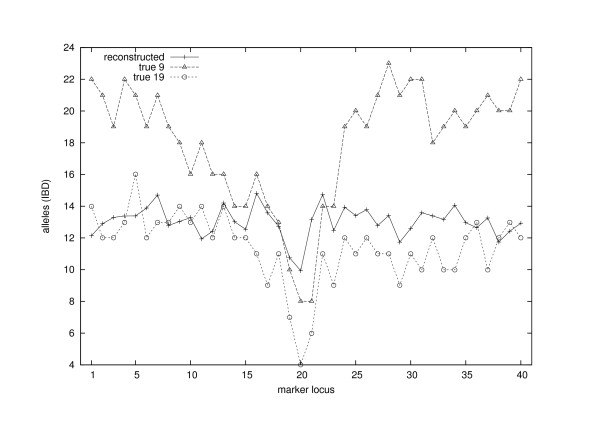
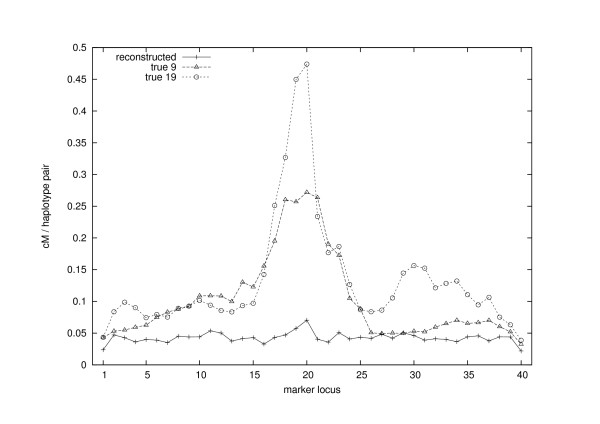
Conclusion: The estimates for IBD (identity-by-descent) and haplotype distributions are tested in several settings using simulated data. The results appear to be promising for a further development of the method.
Figures
Similar articles
-
Bayesian quantitative trait locus mapping based on reconstruction of recent genetic histories.Genetics. 2009 Oct;183(2):709-21. doi: 10.1534/genetics.109.104190. Epub 2009 Jul 20. Genetics. 2009. PMID: 19620396 Free PMC article.
-
Estimating genealogies from unlinked marker data: a Bayesian approach.Theor Popul Biol. 2007 Nov;72(3):305-22. doi: 10.1016/j.tpb.2007.06.004. Epub 2007 Jun 22. Theor Popul Biol. 2007. PMID: 17681576 Review.
-
Approximating identity-by-descent matrices using multiple haplotype configurations on pedigrees.Genetics. 2005 Sep;171(1):365-76. doi: 10.1534/genetics.104.040337. Epub 2005 Jun 18. Genetics. 2005. PMID: 15965257 Free PMC article.
-
Fine-scale mapping of disease loci via shattered coalescent modeling of genealogies.Am J Hum Genet. 2002 Mar;70(3):686-707. doi: 10.1086/339271. Epub 2002 Feb 8. Am J Hum Genet. 2002. PMID: 11836651 Free PMC article.
-
QTL analysis in arbitrary pedigrees with incomplete marker information.Heredity (Edinb). 2002 Nov;89(5):339-45. doi: 10.1038/sj.hdy.6800136. Heredity (Edinb). 2002. PMID: 12399991 Review.
Cited by
-
Estimation of genealogical coancestry in plant species using a pedigree reconstruction algorithm and application to an oil palm breeding population.Theor Appl Genet. 2014 Apr;127(4):981-94. doi: 10.1007/s00122-014-2273-3. Epub 2014 Feb 7. Theor Appl Genet. 2014. PMID: 24504554
-
Bayesian quantitative trait locus mapping based on reconstruction of recent genetic histories.Genetics. 2009 Oct;183(2):709-21. doi: 10.1534/genetics.109.104190. Epub 2009 Jul 20. Genetics. 2009. PMID: 19620396 Free PMC article.
-
Bayesian inference of local trees along chromosomes by the sequential Markov coalescent.J Mol Evol. 2014 May;78(5):279-92. doi: 10.1007/s00239-014-9620-5. Epub 2014 May 11. J Mol Evol. 2014. PMID: 24817610 Free PMC article.
References
-
- Blouin MS. DNA-based methods for pedigree reconstruction and kinship analysis in natural populations. Trends Ecol Evol. 2003;18:503–511. doi: 10.1016/S0169-5347(03)00225-8. - DOI
-
- Cowell RG, Mostad P. A clustering algorithm using DNA marker information for sub-pedigree reconstruction. J Forensic Sci. 2003;48:1239–1248. - PubMed
Publication types
MeSH terms
Substances
LinkOut - more resources
Full Text Sources
Other Literature Sources
