

BMDExpress: a software tool for the benchmark dose analyses of genomic data
- PMID: 17961223
- PMCID: PMC2198920
- DOI: 10.1186/1471-2164-8-387
BMDExpress: a software tool for the benchmark dose analyses of genomic data
Abstract
Background: Dose-dependent processes are common within biological systems and include phenotypic changes following exposures to both endogenous and xenobiotic molecules. The use of microarray technology to explore the molecular signals that underlie these dose-dependent processes has become increasingly common; however, the number of software tools for quantitatively analyzing and interpreting dose-response microarray data has been limited.
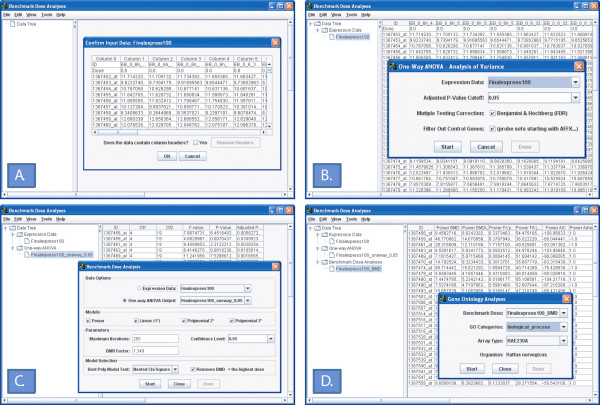
Results: We have developed BMDExpress, a Java application that combines traditional benchmark dose methods with gene ontology classification in the analysis of dose-response data from microarray experiments. The software application is designed to perform a stepwise analysis beginning with a one-way analysis of variance to identify the subset of genes that demonstrate significant dose-response behavior. The second step of the analysis involves fitting the gene expression data to a selection of standard statistical models (linear, 2 degrees polynomial, 3 degrees polynomial, and power models) and selecting the model that best describes the data with the least amount of complexity. The model is then used to estimate the benchmark dose at which the expression of the gene significantly deviates from that observed in control animals. Finally, the software application summarizes the statistical modeling results by matching each gene to its corresponding gene ontology categories and calculating summary values that characterize the dose-dependent behavior for each biological process and molecular function. As a result, the summary values represent the dose levels at which genes in the corresponding cellular process show transcriptional changes.
Conclusion: The application of microarray technology together with the BMDExpress software tool represents a useful combination in characterizing dose-dependent transcriptional changes in biological systems. The software allows users to efficiently analyze large dose-response microarray studies and identify reference doses at which particular cellular processes are altered. The software is freely available at http://sourceforge.net/projects/bmdexpress/ and is distributed under the MIT Public License.
Figures
Similar articles
-
BMDExpress Data Viewer - a visualization tool to analyze BMDExpress datasets.J Appl Toxicol. 2016 Aug;36(8):1048-59. doi: 10.1002/jat.3265. Epub 2015 Dec 15. J Appl Toxicol. 2016. PMID: 26671443 Free PMC article.
-
A method to integrate benchmark dose estimates with genomic data to assess the functional effects of chemical exposure.Toxicol Sci. 2007 Jul;98(1):240-8. doi: 10.1093/toxsci/kfm092. Epub 2007 Apr 21. Toxicol Sci. 2007. PMID: 17449896
-
BMDExpress 2: enhanced transcriptomic dose-response analysis workflow.Bioinformatics. 2019 May 15;35(10):1780-1782. doi: 10.1093/bioinformatics/bty878. Bioinformatics. 2019. PMID: 30329029 Free PMC article.
-
Open source software for the analysis of microarray data.Biotechniques. 2003 Mar;Suppl:45-51. Biotechniques. 2003. PMID: 12664684 Review.
-
The benchmark dose method--review of available models, and recommendations for application in health risk assessment.Crit Rev Toxicol. 2003;33(5):505-42. Crit Rev Toxicol. 2003. PMID: 14594105 Review.
Cited by
-
Classifying polycyclic aromatic hydrocarbons by carcinogenic potency using in vitro biosignatures.Toxicol In Vitro. 2020 Dec;69:104991. doi: 10.1016/j.tiv.2020.104991. Epub 2020 Sep 2. Toxicol In Vitro. 2020. PMID: 32890658 Free PMC article.
-
Computationally prioritized drugs inhibit SARS-CoV-2 infection and syncytia formation.Brief Bioinform. 2022 Jan 17;23(1):bbab507. doi: 10.1093/bib/bbab507. Brief Bioinform. 2022. PMID: 34962256 Free PMC article.
-
Modeling omics dose-response at the pathway level with DoseRider.Comput Struct Biotechnol J. 2025 Apr 3;27:1440-1448. doi: 10.1016/j.csbj.2025.04.004. eCollection 2025. Comput Struct Biotechnol J. 2025. PMID: 40242291 Free PMC article.
-
Python BMDS: A Python interface library and web application for the canonical EPA dose-response modeling software.Reprod Toxicol. 2019 Dec;90:102-108. doi: 10.1016/j.reprotox.2019.07.013. Epub 2019 Aug 12. Reprod Toxicol. 2019. PMID: 31415808 Free PMC article.
-
Capturing time-dependent activation of genes and stress-response pathways using transcriptomics in iPSC-derived renal proximal tubule cells.Cell Biol Toxicol. 2023 Aug;39(4):1773-1793. doi: 10.1007/s10565-022-09783-5. Epub 2022 Dec 31. Cell Biol Toxicol. 2023. PMID: 36586010 Free PMC article.
References
-
- Daoud KF, Jackson CG, Williams HJ. Basic therapy for rheumatoid arthritis: nonsteroidal anti-inflammatory drugs. Compr Ther. 1999;25:427–433. - PubMed
-
- Slikker W, Jr, Andersen ME, Bogdanffy MS, Bus JS, Cohen SD, Conolly RB, David RM, Doerrer NG, Dorman DC, Gaylor DW, Hattis D, Rogers JM, Setzer RW, Swenberg JA, Wallace K. Dose-dependent transitions in mechanisms of toxicity: case studies. Toxicol Appl Pharmacol. 2004;201:226–294. doi: 10.1016/j.taap.2004.06.027. - DOI - PubMed
Publication types
MeSH terms
Substances
Grants and funding
LinkOut - more resources
Full Text Sources
Research Materials
