

Reproducibility of microarray data: a further analysis of microarray quality control (MAQC) data
- PMID: 17961233
- PMCID: PMC2204045
- DOI: 10.1186/1471-2105-8-412
Reproducibility of microarray data: a further analysis of microarray quality control (MAQC) data
Abstract
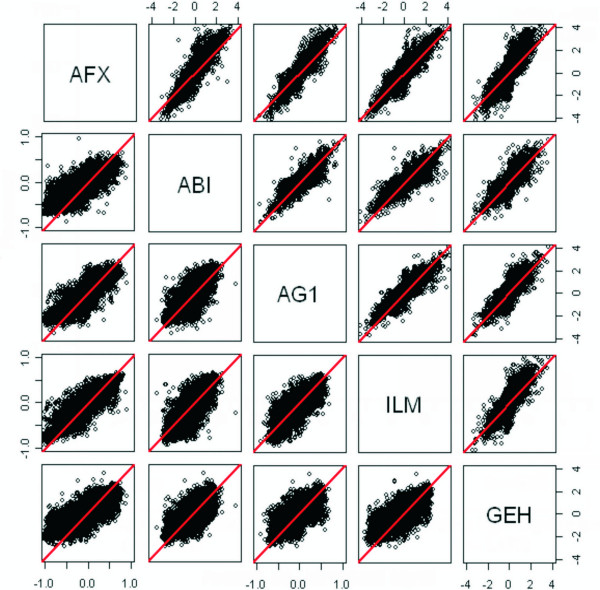
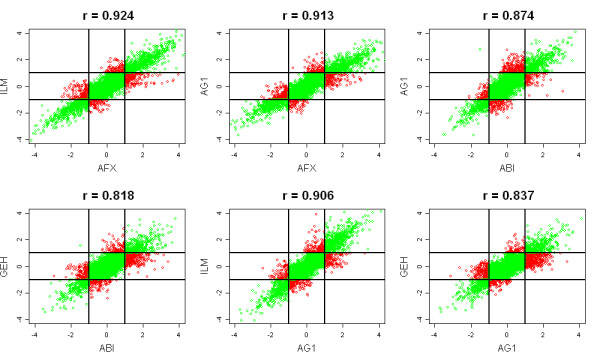
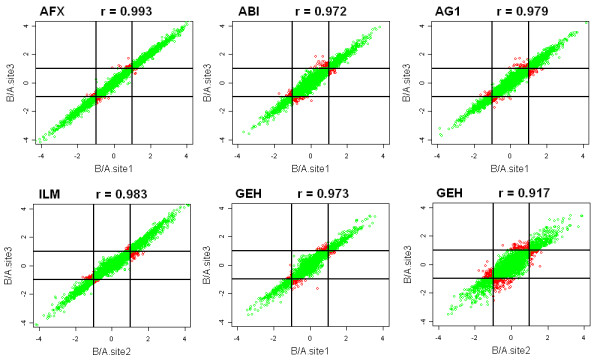
Background: Many researchers are concerned with the comparability and reliability of microarray gene expression data. Recent completion of the MicroArray Quality Control (MAQC) project provides a unique opportunity to assess reproducibility across multiple sites and the comparability across multiple platforms. The MAQC analysis presented for the conclusion of inter- and intra-platform comparability/reproducibility of microarray gene expression measurements is inadequate. We evaluate the reproducibility/comparability of the MAQC data for 12901 common genes in four titration samples generated from five high-density one-color microarray platforms and the TaqMan technology. We discuss some of the problems with the use of correlation coefficient as metric to evaluate the inter- and intra-platform reproducibility and the percent of overlapping genes (POG) as a measure for evaluation of a gene selection procedure by MAQC.
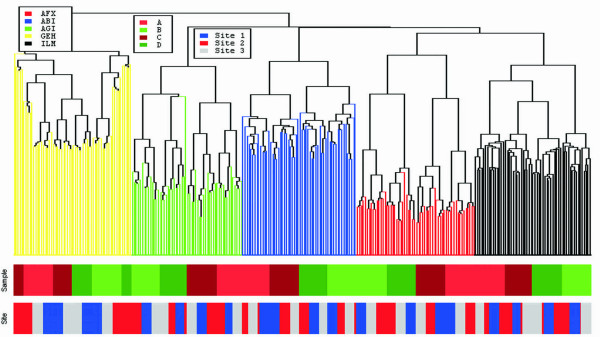
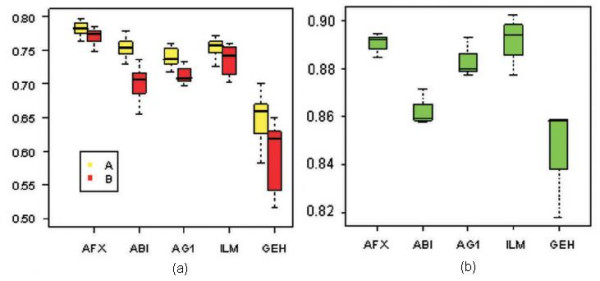
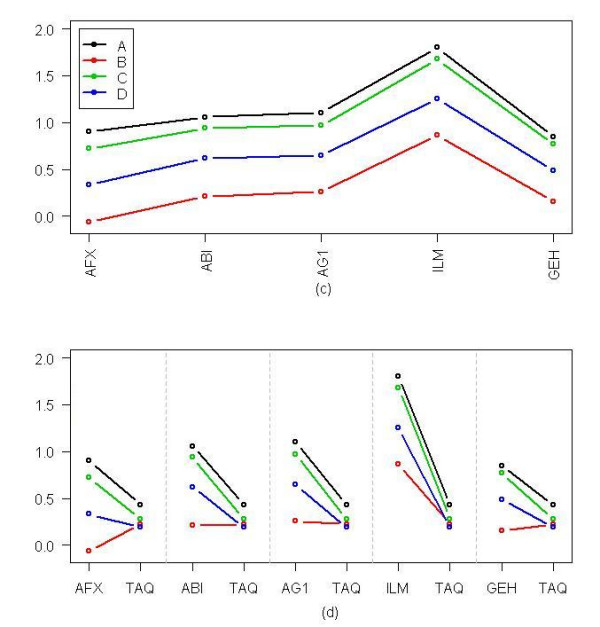
Results: A total of 293 arrays were used in the intra- and inter-platform analysis. A hierarchical cluster analysis shows distinct differences in the measured intensities among the five platforms. A number of genes show a small fold-change in one platform and a large fold-change in another platform, even though the correlations between platforms are high. An analysis of variance shows thirty percent of gene expressions of the samples show inconsistent patterns across the five platforms. We illustrated that POG does not reflect the accuracy of a selected gene list. A non-overlapping gene can be truly differentially expressed with a stringent cut, and an overlapping gene can be non-differentially expressed with non-stringent cutoff. In addition, POG is an unusable selection criterion. POG can increase or decrease irregularly as cutoff changes; there is no criterion to determine a cutoff so that POG is optimized.
Conclusion: Using various statistical methods we demonstrate that there are differences in the intensities measured by different platforms and different sites within platform. Within each platform, the patterns of expression are generally consistent, but there is site-by-site variability. Evaluation of data analysis methods for use in regulatory decision should take no treatment effect into consideration, when there is no treatment effect, "a fold-change cutoff with a non-stringent p-value cutoff" could result in 100% false positive error selection.
Figures
Similar articles
-
Performance comparison of two microarray platforms to assess differential gene expression in human monocyte and macrophage cells.BMC Genomics. 2008 Jun 25;9:302. doi: 10.1186/1471-2164-9-302. BMC Genomics. 2008. PMID: 18578872 Free PMC article.
-
Cross-platform comparison of SYBR Green real-time PCR with TaqMan PCR, microarrays and other gene expression measurement technologies evaluated in the MicroArray Quality Control (MAQC) study.BMC Genomics. 2008 Jul 11;9:328. doi: 10.1186/1471-2164-9-328. BMC Genomics. 2008. PMID: 18620571 Free PMC article.
-
Evaluation of DNA microarray results with quantitative gene expression platforms.Nat Biotechnol. 2006 Sep;24(9):1115-22. doi: 10.1038/nbt1236. Nat Biotechnol. 2006. PMID: 16964225
-
Microarray RNA transcriptional profiling: part I. Platforms, experimental design and standardization.Expert Rev Mol Diagn. 2006 Jul;6(4):535-50. doi: 10.1586/14737159.6.4.535. Expert Rev Mol Diagn. 2006. PMID: 16824028 Review.
-
Reproducible and reliable microarray results through quality control: good laboratory proficiency and appropriate data analysis practices are essential.Curr Opin Biotechnol. 2008 Feb;19(1):10-8. doi: 10.1016/j.copbio.2007.11.003. Epub 2007 Dec 26. Curr Opin Biotechnol. 2008. PMID: 18155896 Review.
Cited by
-
Cumulus and granulosa cell markers of oocyte and embryo quality.Fertil Steril. 2013 Mar 15;99(4):979-97. doi: 10.1016/j.fertnstert.2013.01.129. Fertil Steril. 2013. PMID: 23498999 Free PMC article. Review.
-
Comparative genomics of Helicobacter pylori strains of China associated with different clinical outcome.PLoS One. 2012;7(6):e38528. doi: 10.1371/journal.pone.0038528. Epub 2012 Jun 6. PLoS One. 2012. PMID: 22701658 Free PMC article.
-
Limited functional conservation of a global regulator among related bacterial genera: Lrp in Escherichia, Proteus and Vibrio.BMC Microbiol. 2008 Apr 11;8:60. doi: 10.1186/1471-2180-8-60. BMC Microbiol. 2008. PMID: 18405378 Free PMC article.
-
An algebra-based method for inferring gene regulatory networks.BMC Syst Biol. 2014 Mar 26;8:37. doi: 10.1186/1752-0509-8-37. BMC Syst Biol. 2014. PMID: 24669835 Free PMC article.
-
A network-based method to evaluate quality of reproducibility of differential expression in cancer genomics studies.Oncotarget. 2015 Dec 29;6(42):44714-27. doi: 10.18632/oncotarget.5987. Oncotarget. 2015. PMID: 26556852 Free PMC article.
References
-
- Irizarry RA, Warren D, Spencer F, Kim IF, Biswal S, Frank BC, Gabrielson E, Garcia JG, Geoghegan J, Germino G, Griffin C, Hilmer SC, Hoffman E, Jedlicka AE, Kawasaki E, Martinez-Murillo F, Morsberger L, Lee H, Petersen D, Quackenbush J, Scott A, Wilson M, Yang Y, Ye SQ, Yu W. Multiple – laboratory comparison of microarray platforms. Nat Methods. 2005;2:345–350. doi: 10.1038/nmeth756. - DOI - PubMed
-
- Dobbin KK, Beer DG, Meyerson M, Yeatman TJ, Gerald WL, Jacobson JW, Conley B, Buetow KH, Heiskanen M, Simon RM, Minna JD, Girard L, Misek DE, Taylor JM, Hanash S, Naoki K, Hayes DN, Ladd-Acosta C, Enkemann SA, Viale A, Giordano TJ. Interlaboratory comparability study of cancer gene expression analysis using oligonucleotide microarrays. Clin Cancer Res. 2005;11:565–572. - PubMed
Publication types
MeSH terms
Substances
LinkOut - more resources
Full Text Sources
Other Literature Sources
